


Use the link performance chart (Fig. 1) to analyze the link performance dynamics during the day. This will provide you with insights as to when it is best to start sending further emails.
You can view the link performance chart on the [Email totals] tab. It is updated every 30 minutes.
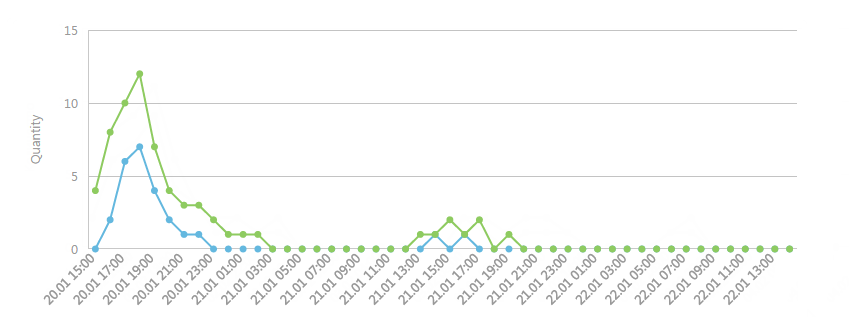
The line chart is used to display the number of unique opens and clicks.
The X-axis displays the period after the email start (2 days by default) in 1-hour intervals.
The Y-axis displays the number of unique recipients. If a recipient opens an email and clicks on a link several times within a certain time, the graph will only take into account the time of the first open and click. Also, if a recipient opens an email and clicks on the unsubscribe link, the chart will record an additional open and click.
Note
You can change the period of the link performance chart via the “Stats update interval for emails, hrs” system setting.
See also