


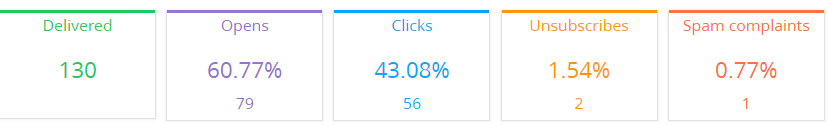
The delivery statistics diagram (Fig. 1) displays metrics for unique email responses. The data is updated every 5 minutes.
Fig. 1 Delivery statistics diagram
Note
The data on the delivery statistics diagram and the [Email totals] may differ from the data on the [Audience] tab. This is because Creatio receives aggregated and individual responses at a different rate.
The data is displayed on separate “metric” dashboard components. Each indicator can have either a percentage or a quantitative value. The percentages are displayed to the total number of delivered emails (the [Delivered] metric).
| Delivered | The number of delivered emails. Indicates the total number of recipients, whose mail provider response is “Accepted by the server”. You can display this metric in the list using the [Delivered] column. |
| Opens | The number and percentage of times emails were opened. The indicators are calculated based on opens by unique recipients. For example, if a recipient opens an email several times, the indicators will show only one “open”. These indicators account for cases when no information about opening the email was received from the recipient, while information about clicked links, unsubscription or flagging the email as spam exists. Both cases automatically imply that the email was opened, since the recipient needs to open an email to unsubscribe or click a link in it. The metric can be displayed in the list using the [No. of opens] and [Opens, %] columns. |
| Clicks | The number of emails where recipients followed links in the message text and its percentage to the number of delivered mails. The indicators are calculated based on clicks by unique recipients. For example, if a recipient follows same link in the same email several times, this will still count as a single click. Clicking the “unsubscribe” link does not count as a “click” in this metric. The metric can be displayed in the list using the [Number of clicks] and [Clicks, %] columns. |
| Unsubscribes | The number and percentage of unsubscribed recipients. The metric can be displayed in the list using the [No. of unsubscribes] and [Unsubscribe rate, %] columns. |
| Spam | The number and percentage of times the emails were sent to spam. Only manual spam flagging will be calculated. The metric can be displayed in the list using the [No. of spam complaints] and [Spam rate, %] columns. |
Note
You can also view the number of sent emails. To do this, display the [Sent count] column in the list.
See also