Sales waterfall pipeline
Sales leaders can usually tell that pipeline changed between two points in time, but not why. Pinpointing which specific deals or events drove a change normally means digging through individual opportunity records by hand — making it hard to assess pipeline health at a glance.
The Sales waterfall pipeline breaks the total pipeline change down into distinct drivers — new opportunities, amount changes, close date shifts, and closed outcomes. This shows you exactly what moved the pipeline. Learn more: Revenue intelligence overview.
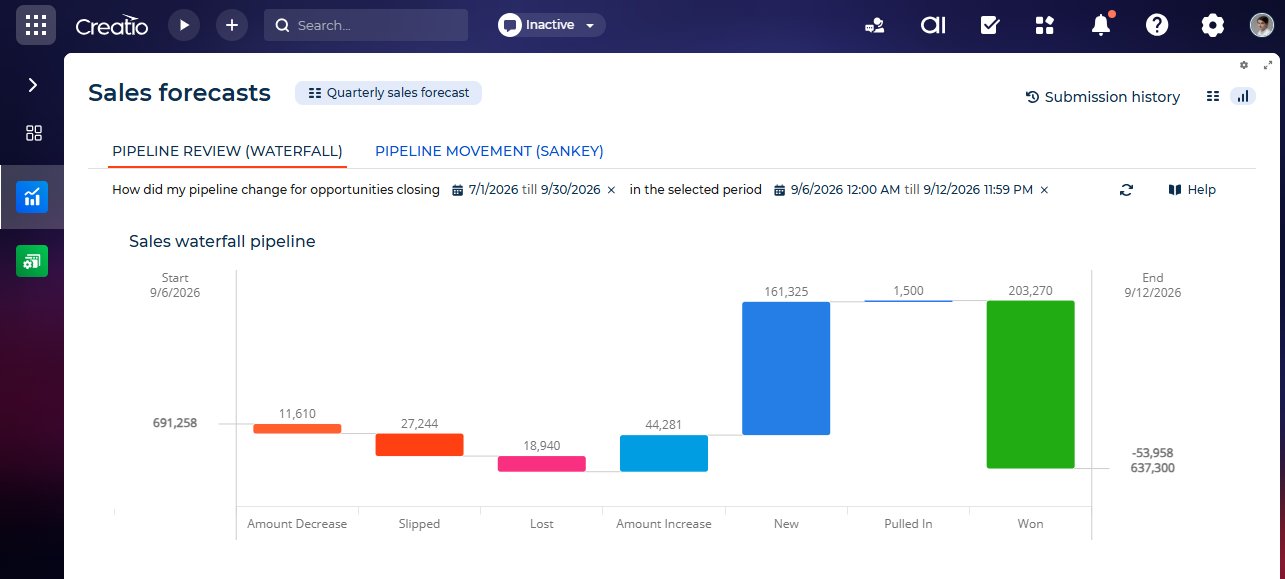
The chart compares your pipeline at two points in time — the start and end of the selected Changes Period. It breaks the difference into columns showing what drove the change. This comparison doesn't rely on two stored snapshots. Instead, Creatio reconstructs both points in time from a historical data layer that records how each opportunity's key fields changed over time. This works automatically for base opportunity fields. If your sales process uses custom objects or field names, this needs extra setup. Learn more: Enable historical tracking for custom fields.
Chart location
The chart is available in the following places:
- In the Sales forecasts section, on the Dashboards view, under the Pipeline Review (Waterfall) tab.
- On the Opportunities list page, as a Pipeline analytics tab, which opens the "Sales pipeline review (Waterfall)" screen with base filtering applied. This tab renders only on the list page when the feature is enabled — it does not appear on any form (record) page.
- As a component you can add to a page in the Freedom UI Designer, under the name Sales waterfall pipeline. Learn more: Configure the Sales waterfall pipeline dashboard for a custom page.
Start pipeline and End pipeline
Headline totals anchor the chart:
- Start pipeline (left bar) — the total open pipeline value at the beginning of the selected period. Creatio calculates it as the sum of all opportunities that, on the starting date, fall within the selected scope and match the applied filters. These opportunities must also still be open (not "Closed Won" or "Closed Lost").
- End pipeline (right bar) — the total pipeline value at the end of the period, after Creatio applies all changes that occurred during the selected period.
The columns between the two bars are the change cohorts. Each one represents a specific driver that moved the pipeline from Start pipeline to End pipeline.
Change cohorts
Cohort | What it represents |
|---|---|
Amount Decrease | Opportunities still closing in the selected close date period whose amount decreased during the change period. |
Slipped | Opportunities that were in the selected close date period but whose close date moved out of it during the change period. |
Lost | Opportunities in the selected close date period that were marked "Closed Lost" during the change period, so they drop out of the open pipeline. |
Amount Increase | Opportunities still closing in the selected close date period whose amount increased during the change period. |
New | Opportunities created during the change period with a close date in the selected close date period. |
Pulled In | Opportunities that entered the selected close date period from a later period during the change period. |
Pushed In | Opportunities whose close date moved into the selected close date period from an earlier period during the change period, often after cleanup of overdue deals. |
Won | Opportunities in the selected close date period that were marked "Closed Won" during the change period. They exit the open pipeline as booked. |
When an opportunity qualifies for more than one cohort, the chart attributes it using this priority order:
- "Closed Lost"
- "Closed Won"
- "Slipped"
- "New"
- "Pulled In"
- "Pushed In"
- "Amount Increase"
- "Amount Decrease"
Periods that drive the calculation
Every view of the chart depends on the following periods, and Creatio needs both to calculate correctly:
- Changes Period — defines when updates happened: the time window in which opportunities were created or modified.
- Fiscal Period — defines what you analyze: the set of opportunities whose close date falls into the selected fiscal or calendar period.
To keep the calculation correct, the chart ignores opportunity quick filters and folders applied to close date and stage. Other filters continue to apply.
See also
Configure the Sales waterfall pipeline dashboard for a custom page