Revenue intelligence overview
Revenue intelligence is a set of tools in Creatio that helps you track your accounts, opportunities, and pipeline, and act on what you find. Use it to see which deals are on track to close and which are quietly slipping away. It also helps you establish a regular forecasting cadence and improves forecast accuracy with data-driven insights, instead of relying on seller judgment alone.
Revenue intelligence continuously evaluates CRM and activity signals — deal progression and pipeline changes — and turns them into recommendations you can act on. It helps sales teams act on what the data shows rather than reacting after problems become visible.
The set of tools for Revenue intelligence comes packaged in the following apps: Lead and Opportunity Management, included with Creatio Sales, and Sales Forecasts, which you install separately from the Creatio Marketplace.
Sales forecasts
Creatio also has a separate Forecasts section for general-purpose planning. Use it to forecast values for any object in your system — such as products, accounts, or contacts — with fully customizable hierarchies, columns, and calculation formulas. Learn more: Set up a forecast. Revenue intelligence, by contrast, is purpose-built for your pipeline review and sales forecast. It works directly with your opportunities and forecast categories, with minimal setup required to get started.
Use the Sales forecasts section to establish and track your forecasting cadence, with pipeline review and forecasting submissions living in one interactive table, where quota, actual revenue, and progress toward target sit together instead of being scattered across spreadsheets.
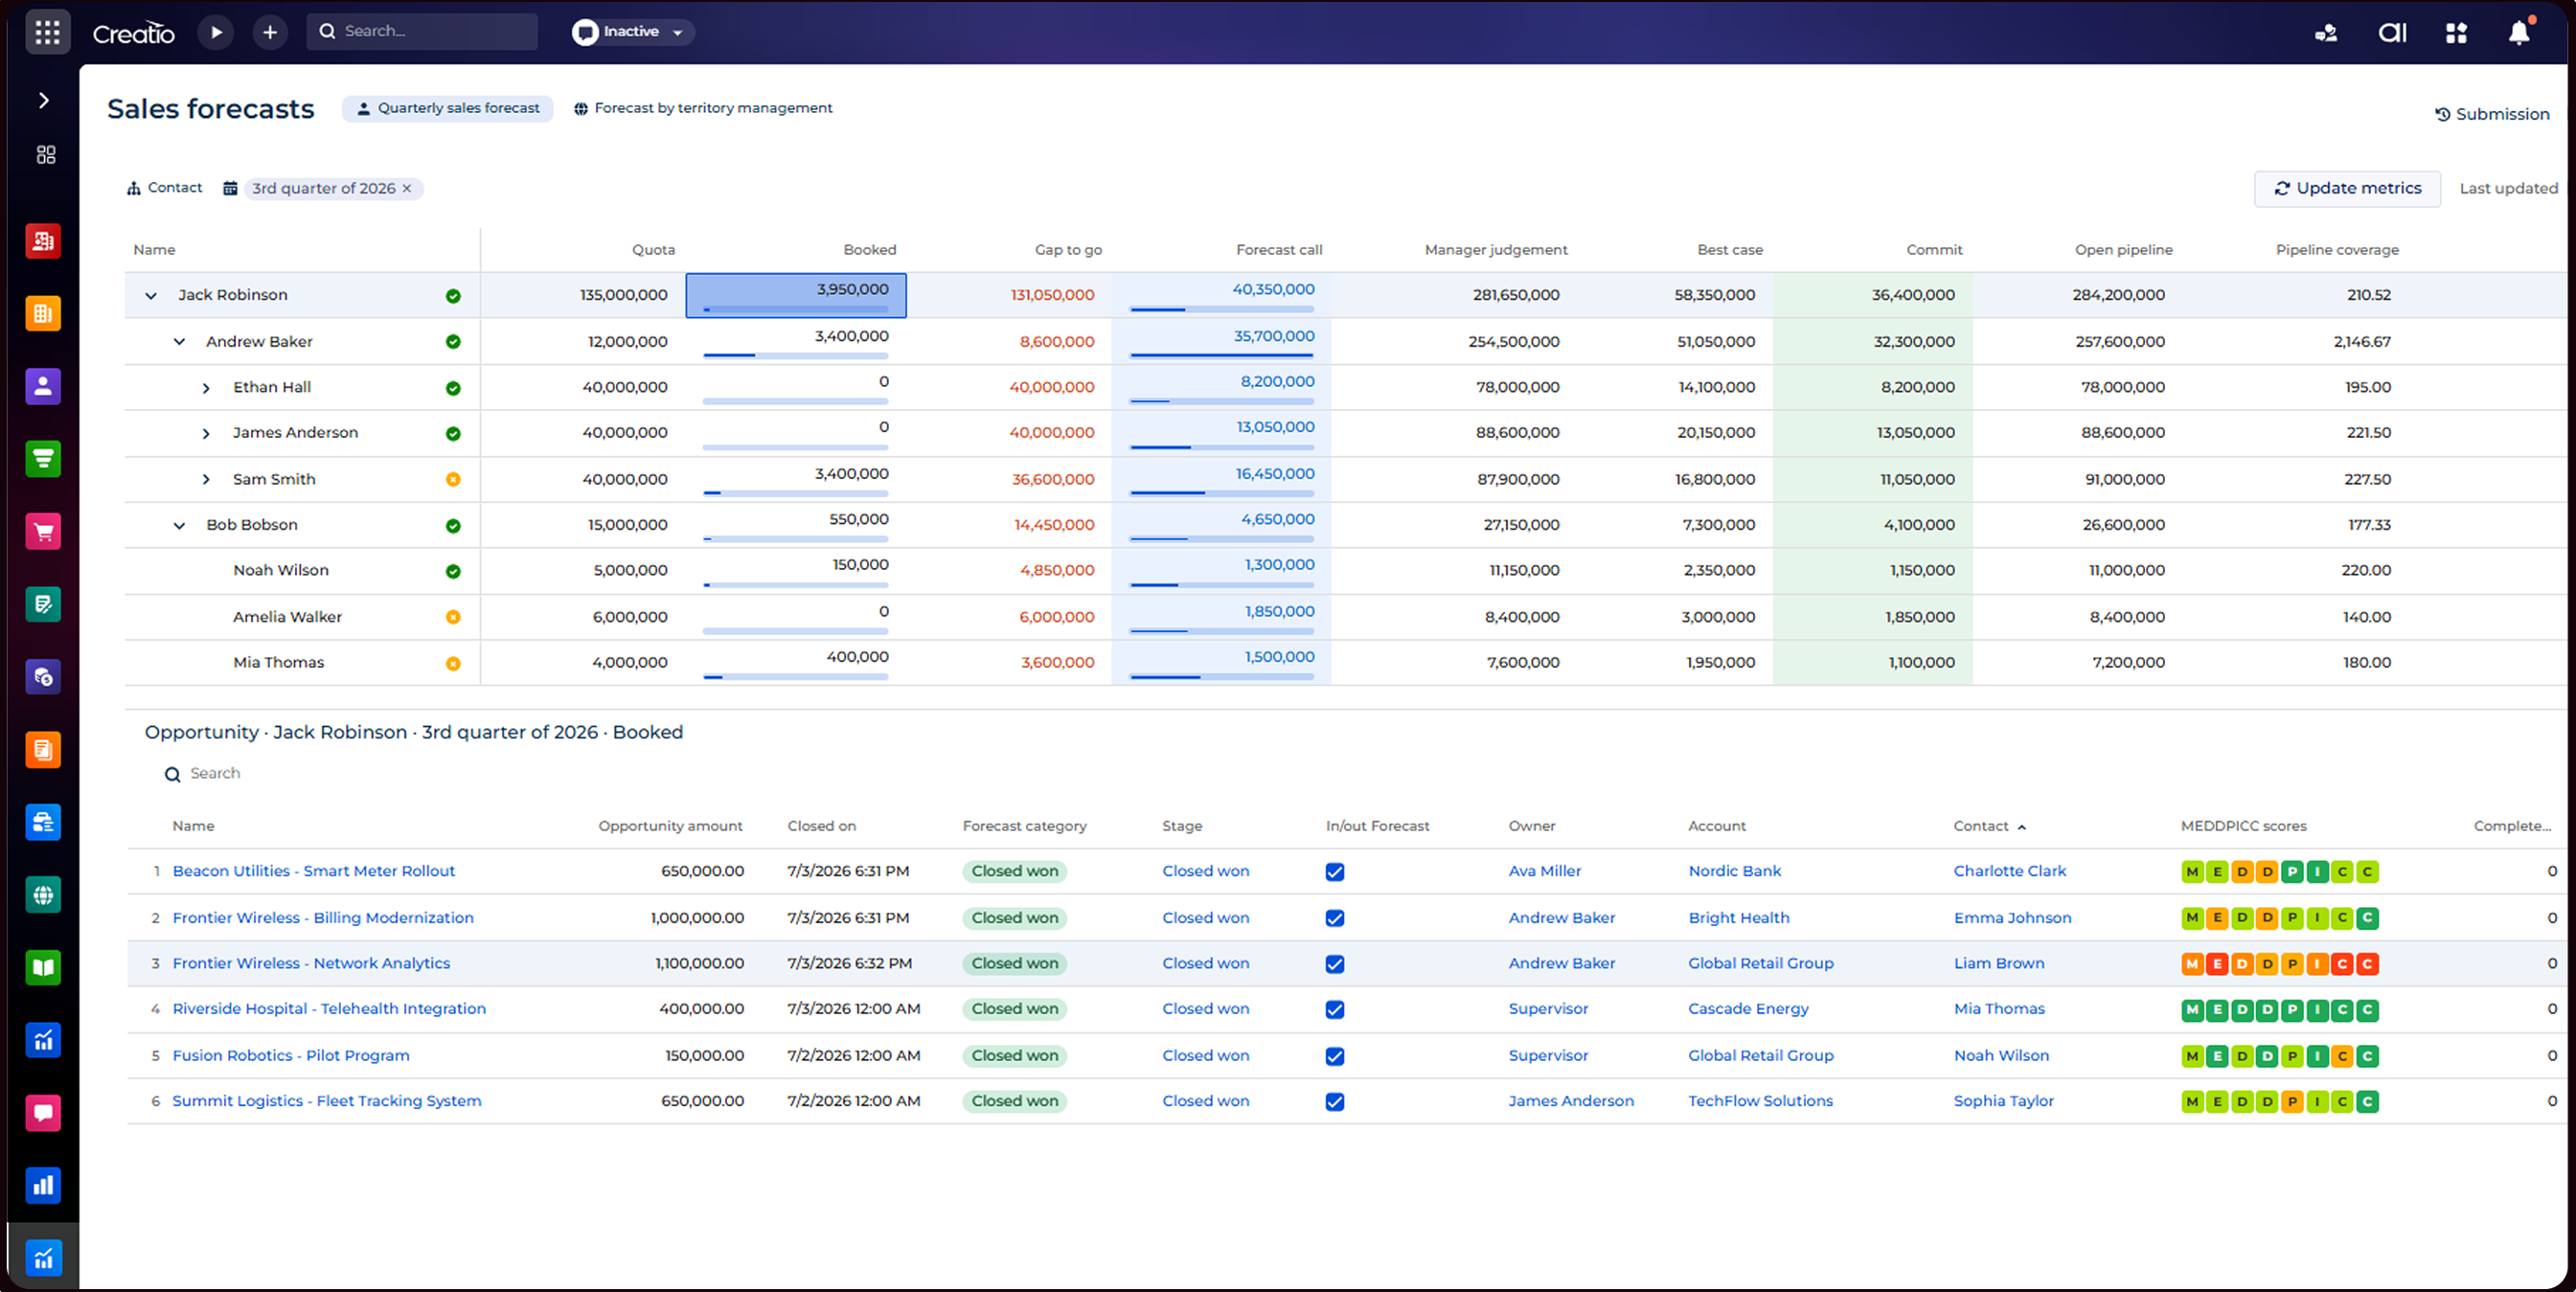
Creatio organizes forecasts as a hierarchy you can expand and collapse — from region, through management levels, down to an individual seller. A leader can move from a top-line total to the exact deals behind it without leaving the forecast. You can structure the hierarchy around the dimension that fits your business by keeping separate forecast sheets. Because the forecast is connected to your CRM data, it recalculates automatically as opportunities change.
Monitor pipeline health
To monitor pipeline health — what's changing and where deals are moving — use the following views:
Use the Pipeline Review (Waterfall) tab, on the Dashboards view of the Sales forecasts section, to see how much your pipeline changed between two points in time and why. It breaks the change down into new opportunities, amount changes, close date shifts, and closed outcomes. Learn more: Sales waterfall pipeline.
Use the Pipeline Movement (Sankey) tab, on the same Dashboards view, to see which forecast categories your opportunities moved between. This shows which opportunities advanced, fell behind, or closed, all in a single visual flow. Learn more: Pipeline movement dashboard.
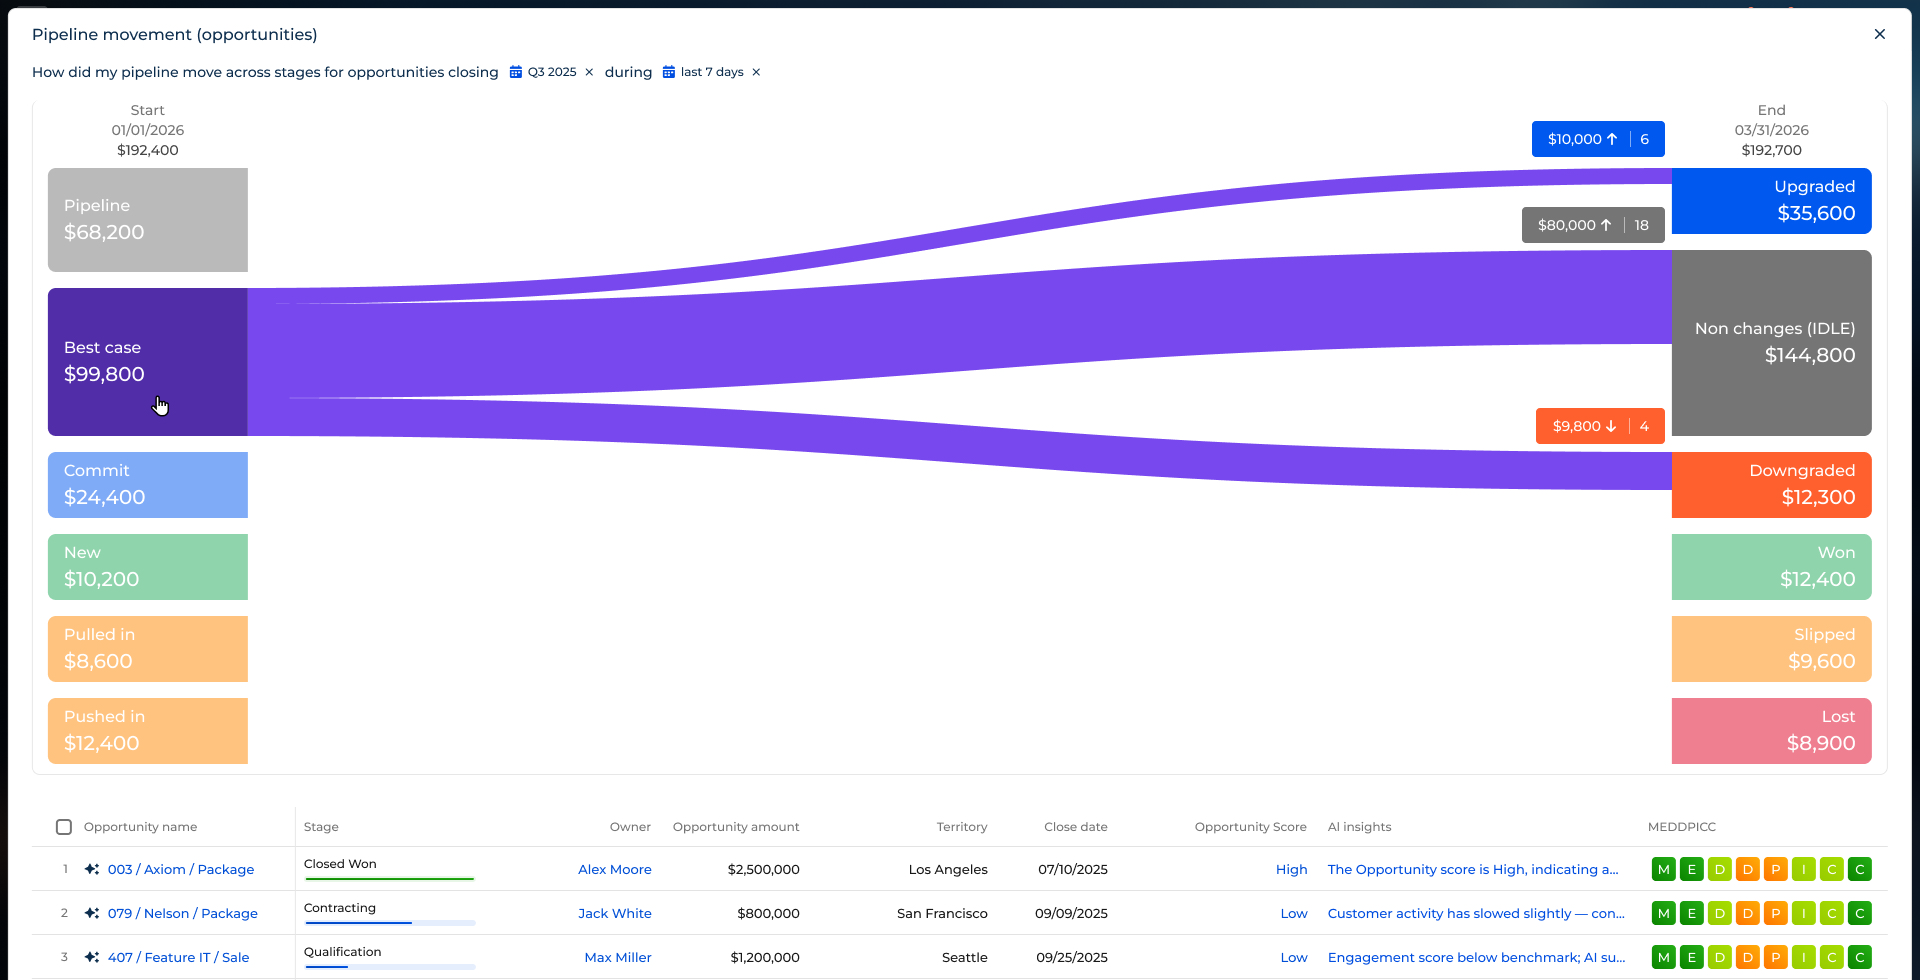
If your sales process uses custom objects or field names, you can extend historical tracking to cover the Waterfall and Pipeline movement charts. Learn more: Enable historical tracking for custom fields.