Server code debugging
Glossary Item Box

Introduction
During the development process on the Creatio platform, developers often need to create the source code for the server schemas of the "source code" type. These may be, for example, existing base schemas, custom configuration classes, web services or business process scripts written in C #. Debug such code is easiest with integrated debugging features of the development environment, for example, Visual Studio. The Visual Studio debugger enables developers to freeze the execution of program methods, check variable values, modify them and monitor other activities performed by the program code.
To begin debugging an application, you need to perform a number of steps:
- Export the Creatio configuration source code to the local directory files
- Create a new Visual Studio project for debugging
- Add the exported files with the source code to the Visual Studio project
- From the project, attach to the working process of the IIS server and start debugging.
ATTENTION
Debugging the code using the method described in this article is only possible for applications deployed on-site.
ATTENTION
Debugging the code using the method described in this article is only possible if the development in the file system mode is turned off (see: “Development in the file system”).
ATTENTION
Enable the [Suppress JIT Optimization] checkbox (the [Options] menu, the [Debugging] > [General] tabs) to be able to get the values of variables during the debugging. More information about optimized and unoptimized code during debugging can be found in the "JIT Optimization and Debugging" Visual Studio guide.
1. Exporting the configuration source code
To do this, perform the application setup.
In the Web.config file located in the root of the application (“external” Web.config), set the “true” value for the debug attribute of the compilation element.
<compilation debug="true" targetFramework="4.5" />
Save the schema to apply changes.
In the Web.config file located in the Terrasoft.WebApp directory of the application (“nternal” Web.config), specify the values for the following items:
- To configure IncludeDebugInformation, specify the “true” value.
- To configure CompilerSourcesTempFolderPath, specify the path to the directory where the source files will be exported.
- To configure ExtractAllCompilerSources, set the value to “true” if you want to export all schemas when performing the [Compile modified items] action in the [Configuration] section. To export only the modified schemas, set the value to “false” (the default value).
<add key="IncludeDebugInformation" value="true" />
<add key="CompilerSourcesTempFolderPath" value="Path_to_local_catalog” />
<add key="ExtractAllCompilerSources" value="false" />
Save the schema to apply changes.
To export the files with server schema source code, perform the [Compile all items] (Fig. 1) action in the [Configuration] section.
Fig. 1 [Compile all items] action
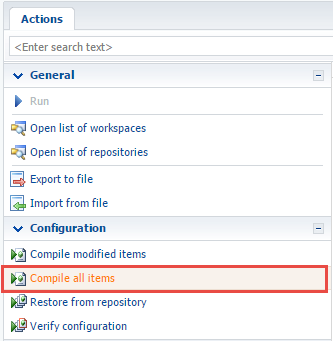
At the time of compilation, the source code files for the application's configuration schemas, as well as configuration libraries, their modules and debug files (* .pdb) will be exported to the folder specified in the CompilerSourcesTempFolderPath configuration of the "internal" Web.config. The schema source code will be exported again every time you compile the application.
NOTE
When compiling, the source code files of the schemas of the work space under which compilation was started will be exported. The files of the downloaded source codes of configuration schemas are named in a certain format: [Name of the schema in the configuration].[Package name]_[Schema type].cs.
For example: Contact.Base_Entity.cs, ContractReport.Base_Report.cs.
2. Creating a Visual Studio project for debugging
ATTENTION
Creating a Visual Studio project is unnecessary to debug the source code – opening the necessary files in Visual Studio is sufficient. However, if debugging is performed frequently, or you need to work with a large number of files at the same time, creating a project will make it easier.
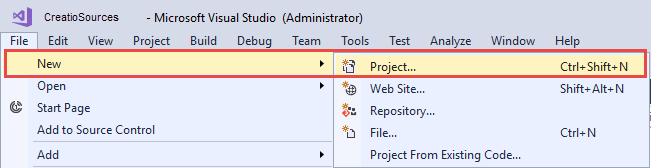
To create a project for debugging an application in Visual Studio, execute the File > New > Projectmenu command (Fig. 2).
Fig. 2 Creating a new project in Visual Studio
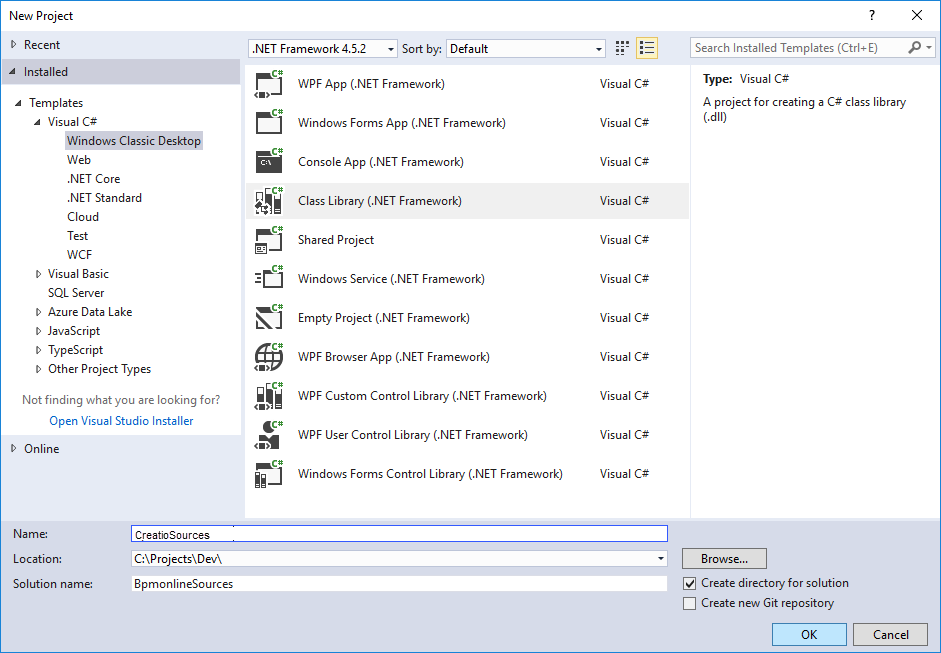
In the properties window of the created project, select the [Class Library (.NET Framework)] project type (class library for the classic Windows application), and specify the name and location of the project (Fig. 3).
Fig. 3 Visual Studio project properties
After creating the project, you need to remove an extra file from it (by default, the file Class1.cs is added to the new project) and save the project.
3. Adding the exported files with the source code to the Visual Studio project
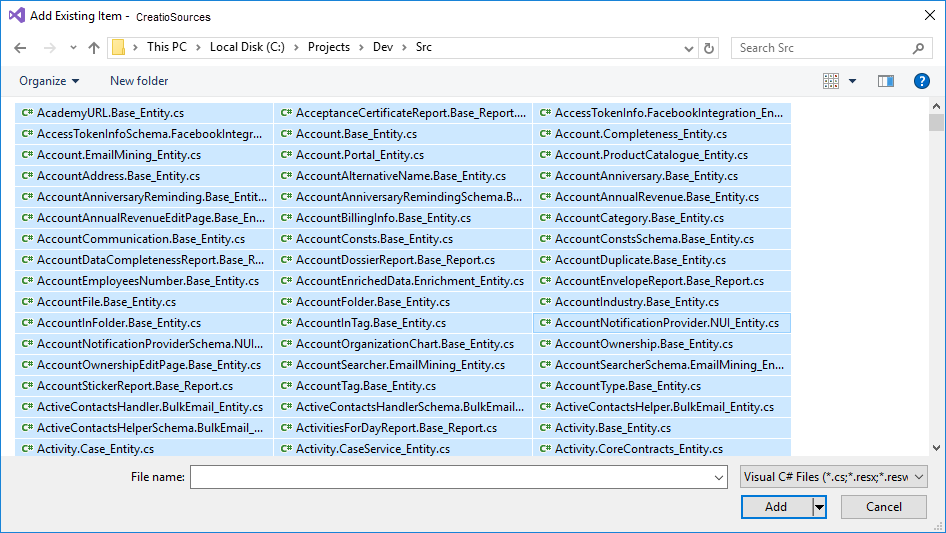
To do this, select Add > Existing Item from the project's context menu in the solution explorer. In the dialog box that appears, you must go to the directory with the downloaded files with the source code and select all files (Fig. 4).
Fig. 4 Adding files to a project
NOTE
Add only the files needed for debugging to the Visual Studio project. However, the transition between methods during debugging will be limited only by the methods of classes implemented in the files added to the project.
Save the project after adding the files.
4. Attaching to the IIS process for debugging
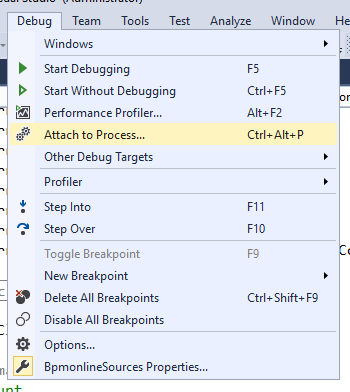
To begin debugging, attach to the IIS server process, where the application runs. To do this, select the Debug > Attach to process command in the Visual Studio menu (Fig. 5).
Fig. 5 Attaching to a process
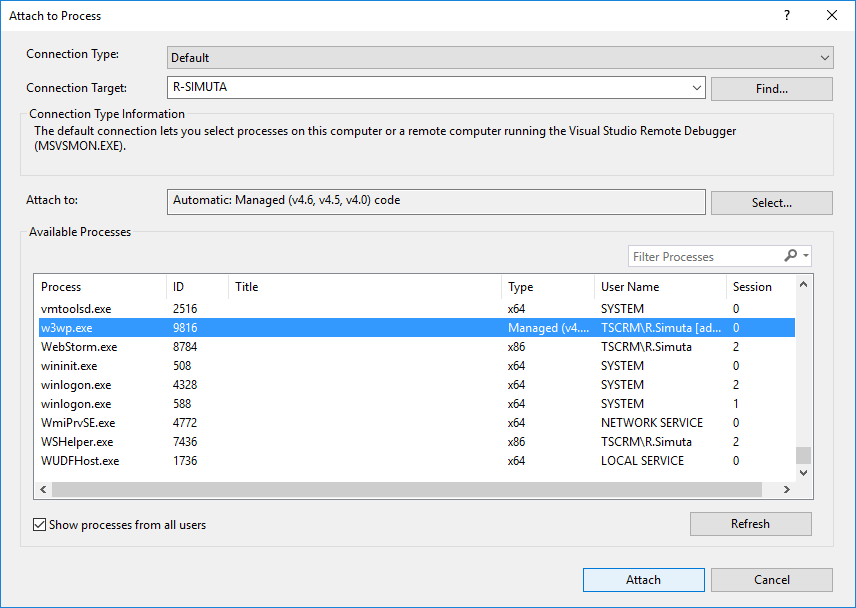
In the opened window, select the working IIS process in the list of processes, where the application pool is running (Fig. 6).
Fig. 6 Attaching to an IIS process
ATTENTION
The name of the working process can be different, depending on the configuration of the IIS server being used. With a regular IIS, the process is w3wp.exe, but with IIS Express, the process name is iiexpress.exe.
By default, the IIS working process is run under the account whose name matches the name of the application pool. To display processes of all users, set [Show processes from all users] checkbox (Fig. 6).
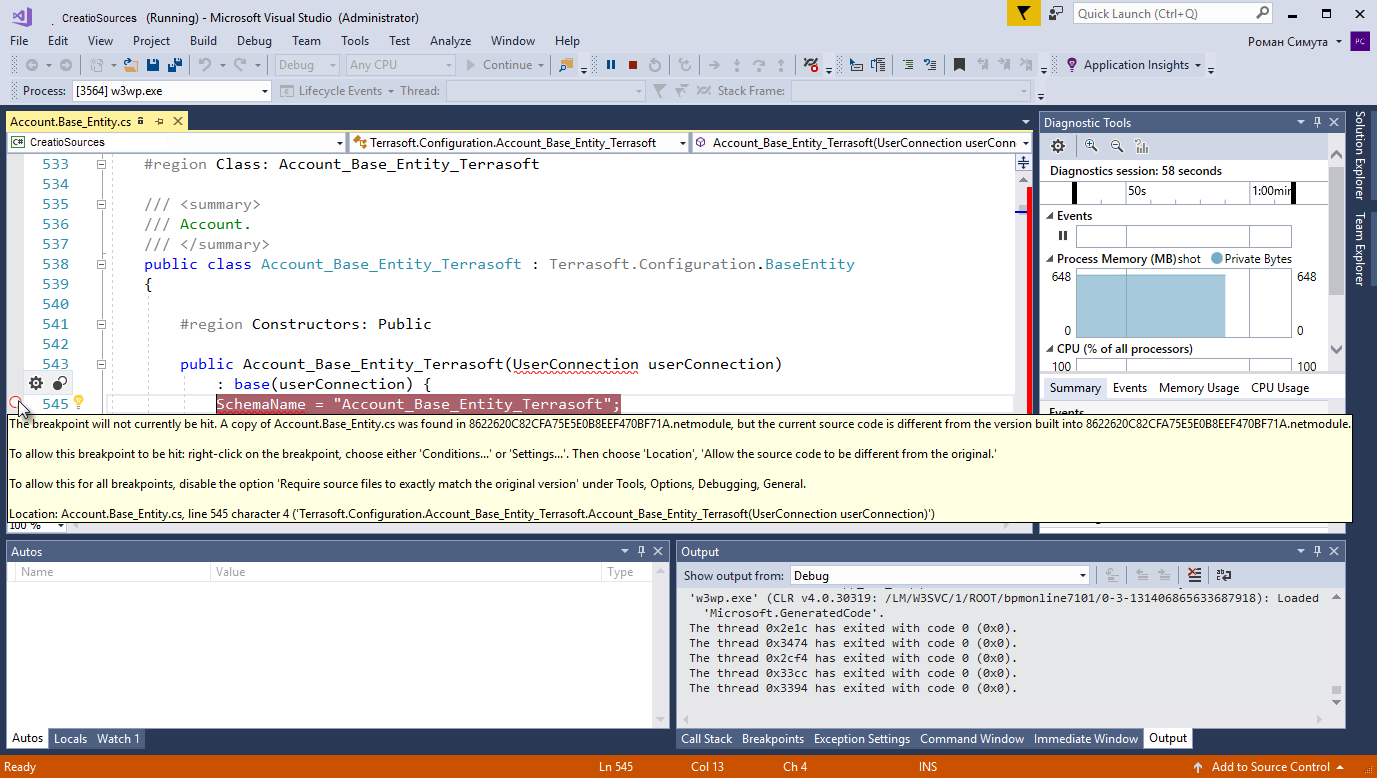
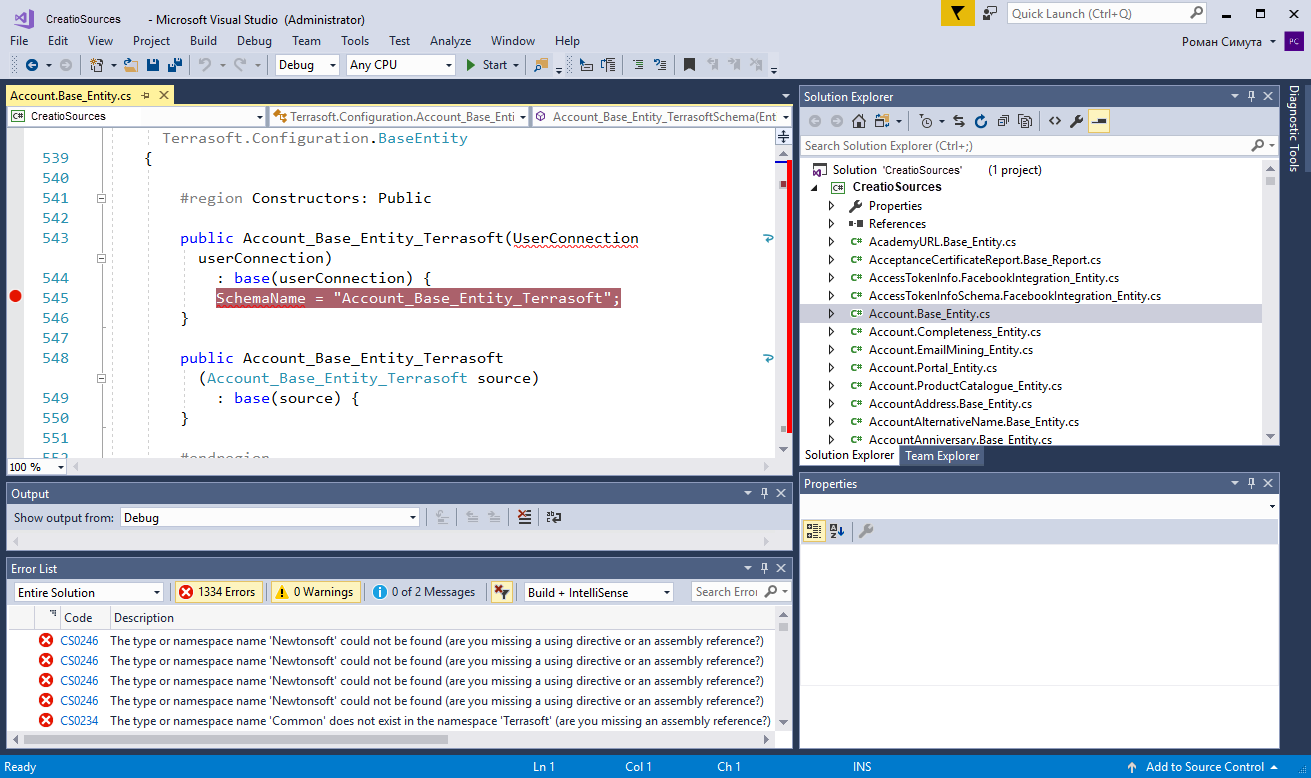
After you attach to the IIS process, you can start debugging. To do this, open the file with the desired source code and set a breakpoint (Fig. 7).
Fig. 7 Breakpoint in the constructor of the [Account] object
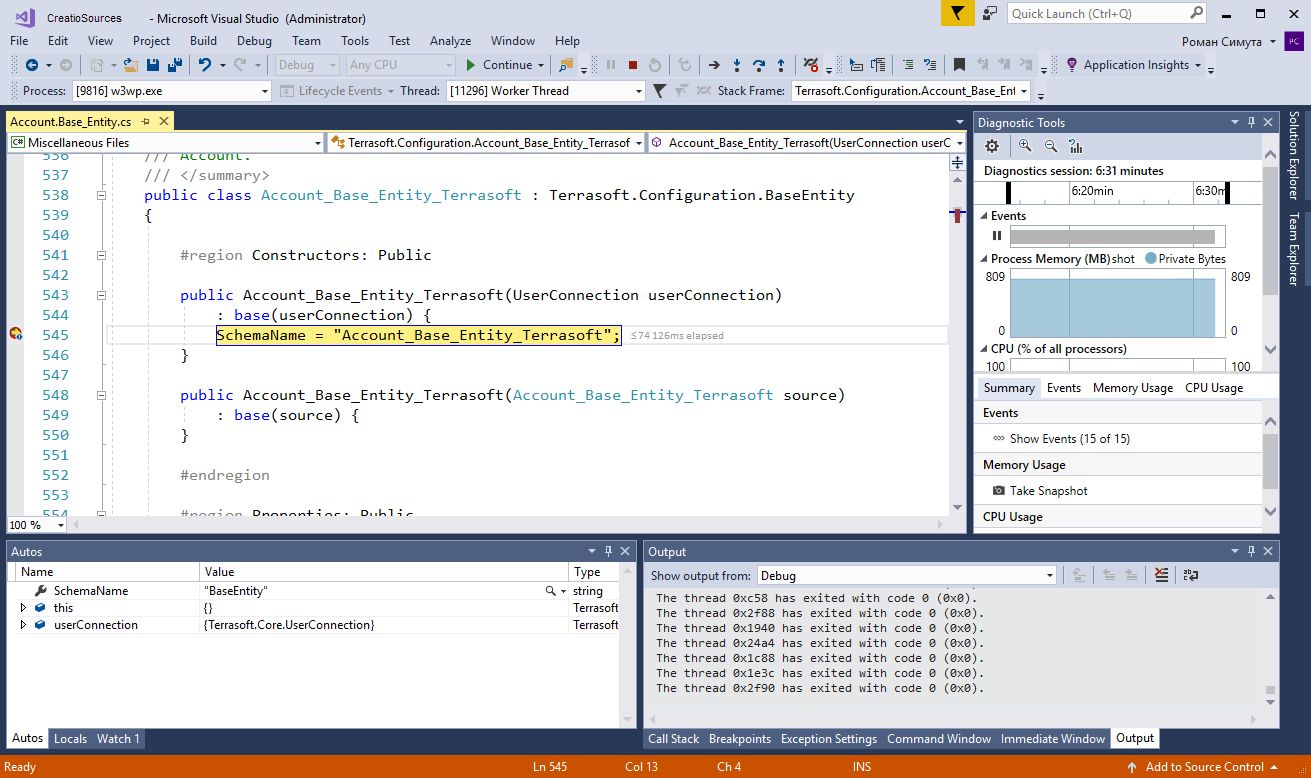
As soon as the method with the breakpoint is used, the program will be stopped and you can view the current state of the variables (see Fig. 8).
Fig. 8 Interrupting the execution of the program on the breakpoint
Possible debugging issues
After attaching to the IIS process, it is possible that the breakpoint symbol is displayed as a white circle bounded by a red circle. A breakpoint is inactive and the application execution will not be interrupted because of it. When you hover the cursor on the symbol of the inactive breakpoint, a hint will appear and notify you of the problem (Fig. 9).
Fig. 9 Inactive breakpoint Characters not loaded
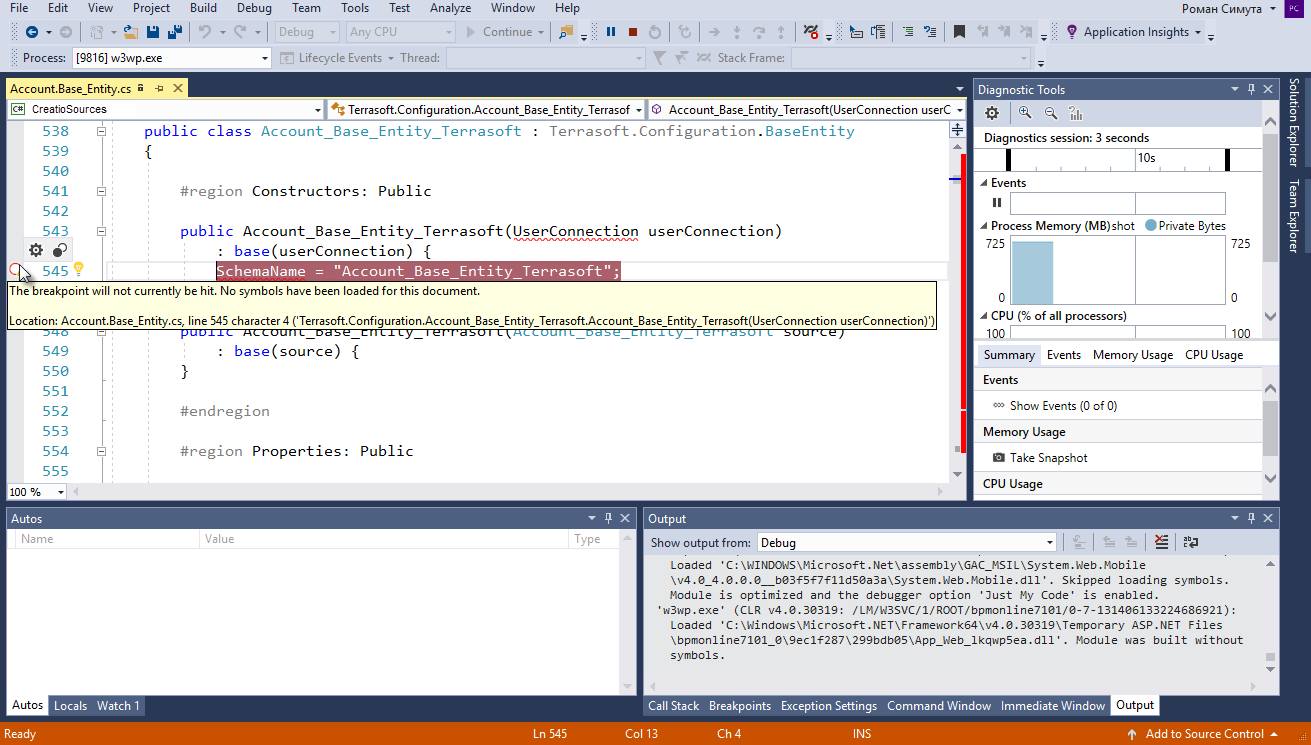
If the hint contains a message that the symbol information was not loaded (Fig. 8), it is necessary to do the following:
- Finish debugging (Debug > Stop Debugging).
- Close the source code file you are debugging.
- Perform the [Compile all items] action in the [Configuration] section of the application (Fig. 1).
- While compiling and re-exporting source files, attach to the IIS process again.
- After the compliation is done, re-open the source code file you are debugging.
NOTE
In some cases, it may be helpful to re-compile without detaching and attaching to IIS.
After the file with the source code is reopened, a message about non-uniform end-of-line characters may appear (Fig. 10).
Fig. 10 Message about non-uniforn end-of-line characters
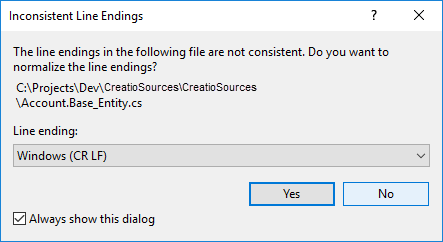
Press the [No] button If you accept the normalization of the characters (the [Yes] button), then the breakpoint may become inactive again. The cause of the problem is displayed in the tooltip - file version mismatch (Fig. 10). The options for solving the problem are also displayed in the tooltip.
Fig. 11 Inactive breakpoint. Version mismatch