


Section analytics
Glossary Item Box

Overview
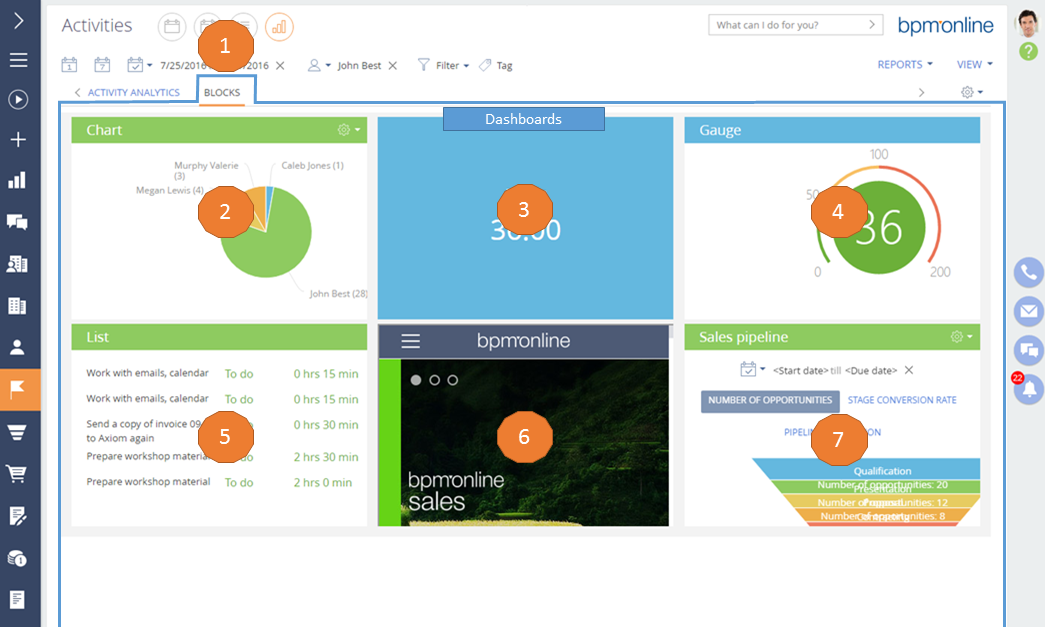
Creatio analytics elements are used for gather statistics on section data. To open section analytics, go to the analytics (dashboards) view (Fig. 1) by clicking the corresponding button (1). To view analytics for all system sections, use the [Dashboards] section.
Analytics elements display information in special blocks called "dashboard blocks". The section area where the dashboard blocks are displayed is called the "dashboard panel". For more information on creating custom dashboard panels, please refer to the "Setting up dashboards" article.
The Creatio application uses the following dashboard blocks (Fig. 1):
Chart (2). Charts are used to visually display data as graphs of various types or as a list of records. For more information on setting up charts, please refer to the "Setting up the “Chart” dashboard component" article in the User Guide.
Metric (3). A metric is used to display single numeric values, for example, the total number of current customers. For more information on setting up metrics, please refer to the "Setting up the “Indicator” dashboard component" article in the User Guide.
Gauge (4). A gauge displays data in relation to a scale.
List (5). A list displays filtered records. For more information on setting up lists, please refer to the "Setting up the “List” dashboard component" article in the User Guide.
Web page (6). This dashboard component displays web pages. This can be a search engine, currency converter page, corporate website, etc
Sales pipeline (7). This dashboard component is used for sales stage dynamics analysis.
The widget dashboard component displays additional custom widgets.
For more information on customizing analytics, please refer to the "Dashboard components setup" article.