


Report designer features
Glossary Item Box

Introduction
Building a report includes two main components: creating a data report structure and a layout of the report page. Use the [Data] toolbar to create data source structure.
ATTENTION
When creating the report, the mechanism for filling out reports with data must be manually set by editing the data source of the report.
The page layout is created by adding lines, columns and other report elements to the workspace. Description of the functional elements of the report designer can be found in the “Report designer workspace” article.
Report page layout
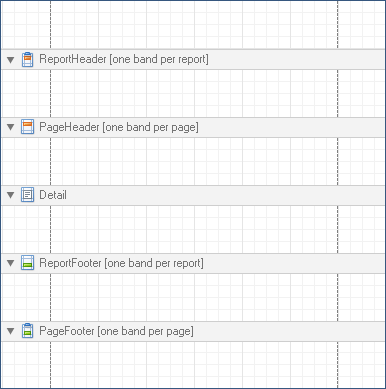
Layout of the report page is performed with bands that correspond to the page report area and displays elements within it (Fig. 1). Elements placed on headers and footers are displayed on each page of the report and the elements placed on the [Report Header] band will be displayed only on the first page of the report.
Fig. 1. Report page layout example
NOTE
To add a line, right-click the workspace and click the [Insert Band] command. Then select the band type.
The [Detail] band is used to display a table in the report and is considered a table row template. One report can only have one [Detail] band.
To add more tables, place nested reports to the report. For example, to display a table with the account name and the account’s primary contact, place two columns on the [Detail] band.
Creating a data report structure
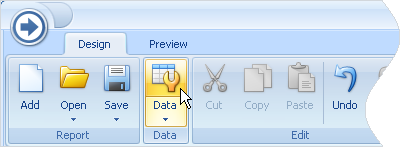
1. Click the [Data] button on the control panel (Fig. 2).
Fig. 2. Adding data to a report
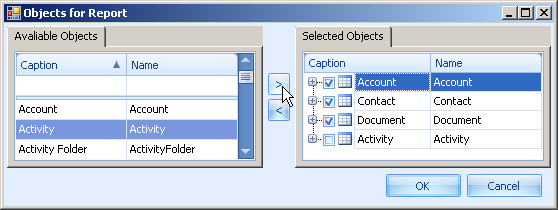
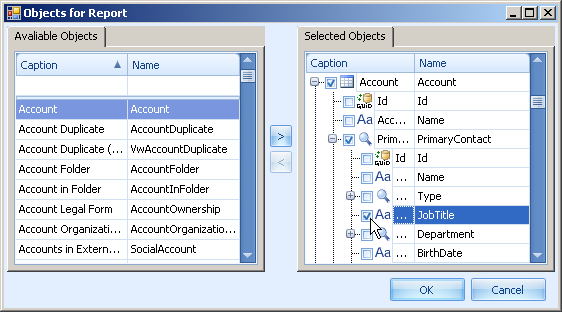
2. Add all objects the data of which will be used in the report to the [Selected objects] area, and enable checkboxes for them (Fig. 3).
Fig. 3. Adding objects to a report
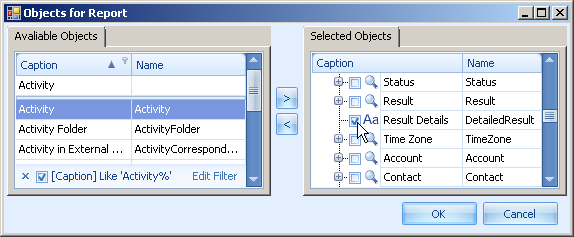
3. Select object columns by enabling or disabling checkboxes on the [Selected objects] area.
Fig. 4. Selecting columns to use in the report
4. Click the [OK] button.
Added objects and their columns will be displayed in the [Data] window.
Adding connected data
You can add to the report columns of any available object and columns of connected objects.
For example, the [Contact] object is connected with the [Account] object via the [Primary contact] column. By adding the [Account] object to the [Selected objects] area, you can add columns of the [Contact] connected object (e.g., [Full name], [Email], etc.). (Fig. 5).
Fig. 5. Adding a connected object column to the report data source
 |
ATTENTION When you add connected data, enable the checkbox for the object the field of which you would like to use. Otherwise the added data will not be connected. |
Columns of the connected object that were added this way will display the information connected with corresponding record of the main object. For example, the [Job] column will display the job of the contact connected with the account by the [Primary contact] column.
Adding data to the report page
Report data structure is displayed in the [Data] window. You can move the columns from the data area to the report designer workspace. Column moved to the workspace is a text object (Fig. 6).
Fig. 6. Text object connected with the object column of the report data

While generating the report, the data from the corresponding database column will be displayed in the place of this object. For example, place a [Full name] column on the designer workspace to display a contact name in the report.
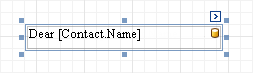
You can place a column on the other report text object. I this case, a variable displaying data of this column will be added to the text of the object (Fig. 7).
Fig. 7. Text object with the added variable
Editing the report data source
Edit the data source manually to fill the report with data from the database and for the advanced report configuration. For example, you can use columns that are not enabled in the system database in the report.
To edit the report data source in the third-party application, you need to save it in the separate file. To do this:
1. Add all necessary data from the system database to the report.
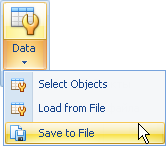
2. Save the report data structure in the .xsd file with the [Data] > [Save to file] menu command (Fig. 8).
Fig. 8. Saving the data source to the .xsd file
3. Open the .xsd file in the third-party application (for example, Microsoft Visual Studio) and preform the required modifications in it.
4. Load edited data source from the .xsd file to the report with the [Data] > [Load from file] menu command.
As a result, all changes made in .xsd file via the third-party application will be imported to the report.