Gauge
Glossary Item Box

General information
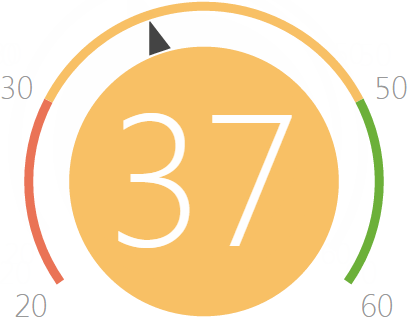
A “gauge" dashboard element displays aggregate data from multiple system records in the form of a dial with green, yellow and red areas on its scale. For example, you may use this dashboard to display a number of performed activities and compare it to a desired rate.
(Fig. 1). A gauge dashboard

Gauge functionality implementation classes
GaugeViewModel – gauge view model.
GaugeViewConfig – generates the gauge view model.
GaugeModule – module designed to work with gauges.
GaugeChart – implements a gauge chart component.
GaugeDesigner – view model schema of a gauge.
Gauge settings
To configure a gauge, you need to add the JSON configuration object with the gauge properties to the widget module configuration. The widget module configuration is defined by the Items property of the SysDashboard object. Learn more about the SysDashboard object and its properties in the “Dashboard widgets” article.
Set the “Gauge” value to the widgetType property in the JSON configuration object with widget settings. In addition, assign the parameters property to the object with necessary parameters. Possible gauge parameters are listed in table 1.
Table 1. Gauge settings
| Name | Type | Details |
|---|---|---|
| caption | string | Gauge header. |
| sectionId | string | Section id. |
| entitySchemaName: | string | Gauge object. |
| sectionBindingColumn | string | Section link column. |


