


The “Full pipeline” dashboard tile
The “Full pipeline” dashboard tile is available in bpm’online products that contain the [Opportunities] section. This dashboard tile is used to analyze sales dynamics by stage, starting with lead registration and up to closing of the corresponding opportunity (Fig. 1).
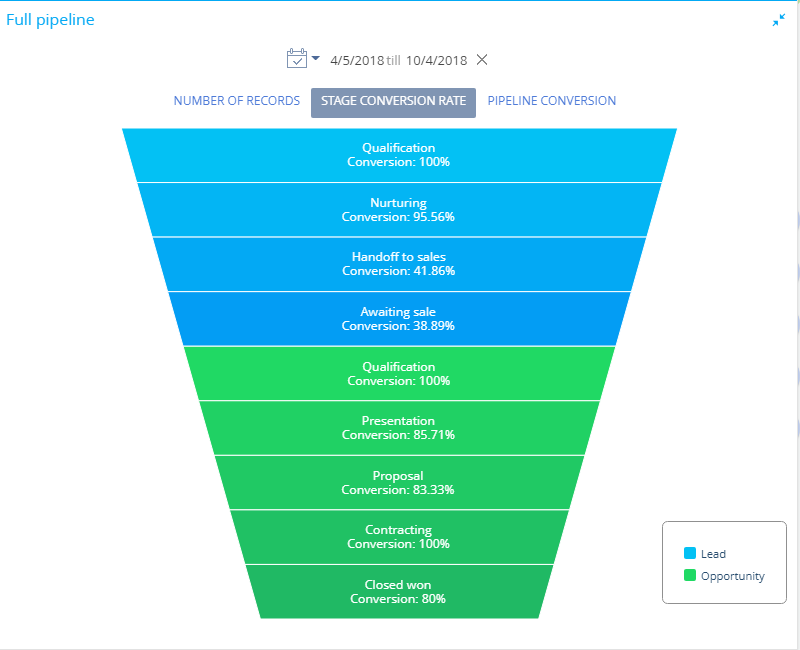
Fig. 1 The “Full pipeline” dashboard tile
Note
The “Full pipeline” dashboard tile should not be confused with the “Chart” dashboard tile of the “Pipeline” type. The “Chart” dashboard tile is described in a separate article.
The diagram element height corresponds to the number of leads and opportunities that are currently at the corresponding stage. The list of stages displayed on the diagram can be configured in the [Lead stage] and the [Opportunity stages] lookups.
The full pipeline has its own quick filter, which you can use to display data for a certain period of time, e.g., for the current month.
Note
The quick filter functions are described in a separate article.
The full pipeline can display data in the following views:
Number of records view displays how the leads and the registered opportunities that started during the specified time are grouped by stages by the end of that period.
For example, of all leads that were registered during the specified period, only 150 have reached the [Qualification] stage by the end of the period. Thus, the pipeline will display 150 leads at the [Qualification] stage.
Stage conversion rate displays the percentage of leads and opportunities that have advanced to a higher stage during the specified time.
For example, there were 20 opportunities at the [Contracting] stage during the specified period. If by the end of the specified period 10 out of these 20 opportunities have advanced to a stage higher than the [Contracting] stage, the stage conversion rate will be 50%.
Pipeline conversion displays the percentage of leads/opportunities at a certain stage, during the specified period against the total number of leads that started during this period.
For example, 100 leads were registered during the specified period, 5 out of these 100 leads reached the [Closed won] stage. Consequently, the [Closed won] stage conversion makes up 5% against the total number of registered leads.
Setting up the “Full pipeline” dashboard tile
When you add or edit a full pipeline, a dashboard tile setup page will open on the dashboard panel. Here you can set up the primary parameters, such as pipeline title, data, and display conditions.
How to filter leads
Set up a filter for selecting the leads to include in the full pipeline. For example, you can display the conversion dynamics of leads registered from a landing page or leads of a particular customer need type.
How to filter opportunities
Set up a filter for selecting the opportunities to include in the full pipeline. For example, you can display the dynamics of leads that were converted to opportunities of the “Enterprise” category or only opportunities with issued orders.
See also