


The “Sales pipeline” dashboard tile
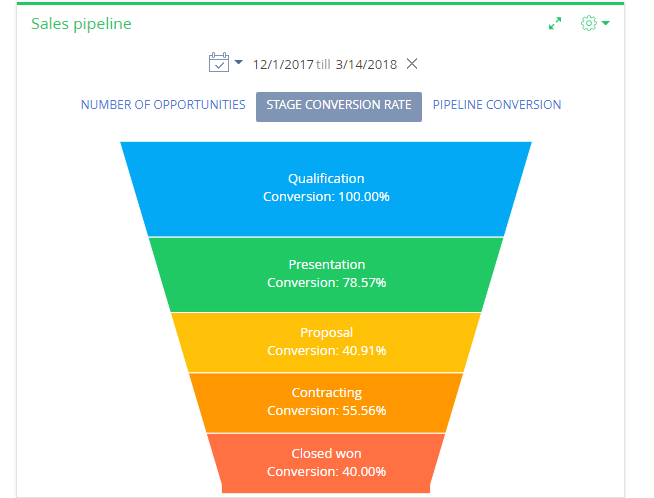
The “Sales pipeline” dashboard tile is available in bpm’online products containing the [Opportunities] section. This dashboard tile is primarily designed to analyze sales dynamics by stage (Fig. 1).
Fig. 1 “Sales pipeline” dashboard tile
Note
The “Sales pipeline” dashboard tile should be distinguished from the “Chart” dashboard tile of the “Pipeline” type. The “Chart” dashboard tile is described in a separate article.
The diagram element height corresponds to the number of current opportunities at the corresponding stage. The list of stages displayed on the diagram is configured in the [Opportunity stages] lookup. Opportunities with ”Closed lost”, ”Closed won”, ”Closed rejected” and ”Closed rerouted” statuses are not taken into account in the pipeline.
The sales pipeline has its own quick filter, which you can use to display data for a certain period of time, for example, for the current month.
Note
The quick filter functions are described in a separate article.
The sales pipeline can display data in the following views.
The number of opportunities displays how the opportunities that started during the specified time period are grouped by stages by the end of that period.
For example, 15 opportunities started during the selected period on the [Proposal] stage. Thus, the pipeline will display 15 opportunities at this stage.
Stage conversion rate displays the percentage of opportunities that have moved from a stage to a higher stage during the specified time period.
For example, there were 20 opportunities at the “Contracting” stage within the selected period. If 10 out of these 20 opportunities have moved to a higher stage than the [Contracting] stage by the end of the selected period, the [Contracting] stage conversion rate is 50%.
The pipeline conversion displays the percentage of opportunities at a certain stage, during the specified period against the total number of opportunities that started during this period.
For example, 100 opportunities started during the selected period and 55 of them passed the [Presentation] stage, so the monthly conversion rate of the [Presentation] stage is 55%.
Setting up the “Sales pipeline” dashboard tile
A pipeline setup page (Fig. 2) will open when you add or edit a sales pipeline on a dashboard panel. You can set up the primary parameters here – pipeline title, data, and display conditions.
Fig. 2 “Sales pipeline” dashboard tile setup page
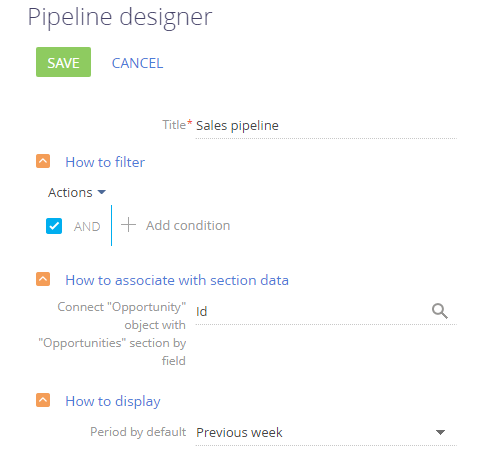
How to filter
Use this detail to specify conditions for selecting the data for building the sales pipeline. For example, to display the sales dynamics within the sales pipeline for a certain owner only, specify the required owner in the filter conditions.
Note
Opportunities with the ”Closed lost”, ”Closed won”, ”Closed rejected” and ”Closed rerouted” statuses are not taken into account.
How to associate with section data
[Connect ... object with ... section by field] – populate the field if you want to display the data only for the selected records of the current section. For example, specify the “Opportunity“ value. As a result, the pipeline will only be built based on the records whose [Opportunity] field contains the same value as in the similar field of the [Opportunity] object.
Note
The sales pipeline is built based on the [Stage in opportunity] object records..
If you leave the field empty, the filters applied in the section will not be considered when building the pipeline.
The field is not displayed when setting up analytics in the [Dashboards] section.
What to display
[Period by default] – a standard filtration period to be used in the quick filter for the sales pipeline, for example, “Current month“.
Note
The quick filter functions are described in a separate article.
See also