


Setting up the “Chart” dashboard tile
A chart setup page (Fig. 1) will open when you add or edit a chart on a dashboard panel. Here you can set up the primary chart parameters: – data, title, filters and display conditions.
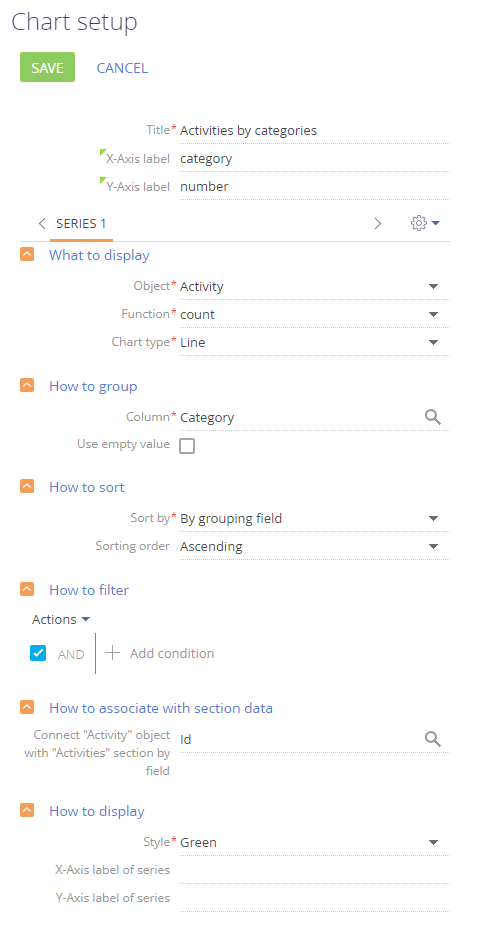
[Title] – the chart name that will be displayed on the dashboard tile.
[X-axis label] and [Y-axis label] – the labels of X and Y-axes that will be displayed on the chart. These fields are only displayed for the charts that contain axes (“spline”, “line”, “area chart” and “scatter chart”).
What to display
[Object] – bpm’online object (section, detail or lookup) whose records you want to use for building the chart. For example, to calculate the average call duration (calls are activities of the “Call” category), select the “Activity” object.
[Function] – the type of value that should be displayed on the chart. The following chart functions are available:
-
“count” – the value is used to build a chart by the number of records in the selected bpm’online object. For example, you can calculate the number of activities of each type.
-
“maximum”, “minimum”, and “average” – the values calculated by numeric column (or a date column with the exception of the “average” function) in the specified object. For example, you can calculate the average duration of employee activities.
-
“sum” – the sum of values of the specified numeric column of the selected object. For example, you can calculate the employee's total activity duration for a week.
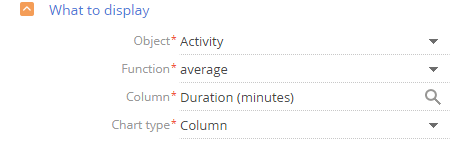
[Column] – the column to be used in the calculation. The list includes numeric columns and date columns. For example, specify the “Duration (minutes)” value to calculate the average call duration by managers (Fig. 2). This field is not displayed if the “count” value is selected in the [Function] field.
[Chart type] – the type of the chart: “Bar chart”, “Pie chart”, etc.
Fig. 2 Setting up the [What to display] field group for a chart
How to group
[Column] – the column to group the chart values by (each value in this column will be represented as a separate chart element – bar, sector, etc.). For example, select the “Owner” field to calculate the number of activities by owner. You can group data by any column of the selected object.
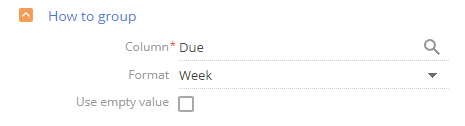
[Format] – the format of dates that will be displayed on the chart, for example, “Week” or “Month & Year”. This field is displayed if the date value is selected in the [Column] field in the [How to group] block. For example, to calculate the number of completed activities by week, specify “Week” in the [Format] field and “Due” in the [Column] field.
Fig. 3 Setting up the [How to group] field group for a chart
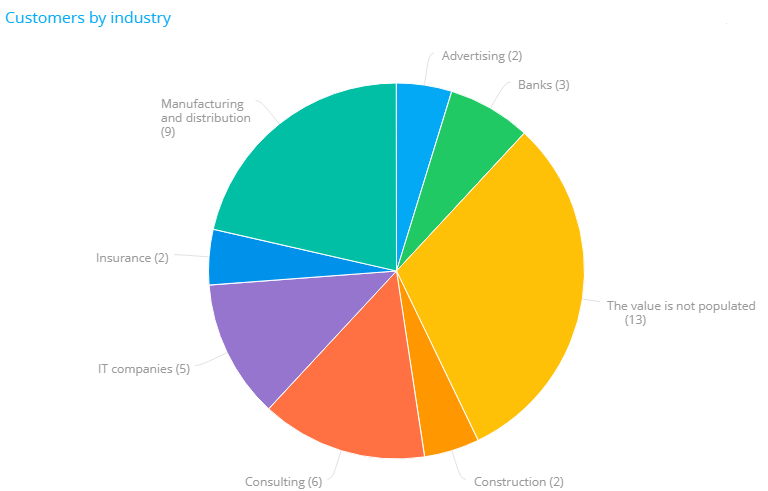
[Use empty value] – if the checkbox is selected, the chart will include the records, whose grouping column is not populated (Fig. 4).
Fig. 4 “Customers by industry” chart including empty values
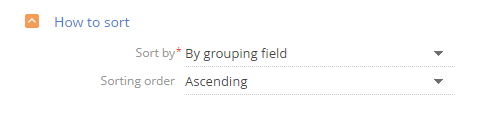
[Sort by] – the value to sort chart areas by. For example, the values in the “Activities by owner” chart are grouped by the [Owner] field, with each chart block representing a certain number of activities. Select “By grouping field” to sort chart areas alphabetically (in this case by the [Owner] field) or select “By selection result” to sort chart areas by number of activities.
[Sorting order] – the sorting order for the chart areas (by the values selected in the [Sort by] field) in ascending or descending order (Fig. 5).
Fig. 5 Setting up the [How to sort] field group for a chart
How to filter
Use the standard filter area to filter the chart data. For example, to create a chart that displays how contacts were added within the specified time period, specify the needed period in the filter conditions, for example, “Created on = Current month” (Fig. 6).
Fig. 6 Setting up the [How to filter] field group for a chart
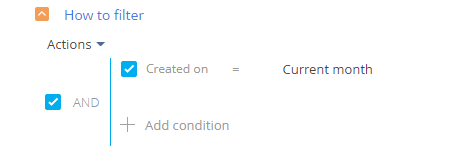
The filter becomes available when the [Object] field is populated.
Note
You can find more information about the advanced filter in a separate article.
How to associate with section data
[Connect ... object with ... section by field] – select a chart object column in this field if you want to display the data according to the section filters. If you leave this field unpopulated, the applied section filters will not affect the chart data. The field will be populated automatically if you configure dashboards for the object of the current section. The field is displayed if the [Object] field is populated and is not available at all if you configure charts in the [Dashboards] section.
You can connect a chart to section records in a number of ways.
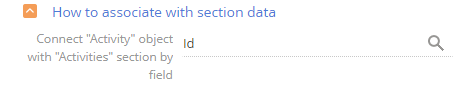
1.The chart is built based on the records of the current section (the chart object corresponds to the section object). For example, when creating a chart in the [Activities] section, you select “Activity” in the [Object] field. In this case, the connection field is populated automatically with the [Id] column.
a.If you select the [Id] column in the field (Fig. 7), the chart will be built based on the records that correspond to the filter conditions specified in the section. For example, if you apply a filter to the [Activities] section list so that only completed activities are shown, the “Activities by owner” chart will display only the information related to the completed activities.
Fig. 7 Connecting a chart to a section by the “Id” field
b.If you clear the connection field, the chart will display the information for all section records, regardless of the set filter conditions.
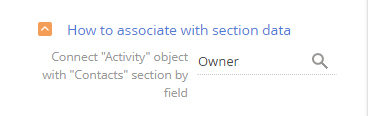
2.The chart is based on the records from another section (the chart object is different from the section object). For example, there is an “Activities by owner“ chart added to the [Contacts] section to display number of activities by owner. The chart object columns available for selection in the [Connect…] field are filtered according to the current section object (in this case, the available columns will be [Contact], [Owner], [Created by], etc.).
a.If you populate the [Connect…] field (Fig. 8), the chart will use only records that are connected to the section records via the specified column. Then, if you set a filter in the [Contacts] section, the chart will only display the information related to the activities whose owners are displayed in the section. Or you can select the “Author“ column – in this case, the chart will only display the information related to the activities added by the specified contacts.
Fig. 8 Connecting a chart to a section by the “Owner“ field
b.If you leave the connection field unpopulated, the chart will display the information for all records of the chart object, regardless of the section filter conditions.
c.The chart data may not be related to the section data at all (in this case, the [Connect…] field should also be left empty). For example, you can add the “Activities by owner” chart to the [Knowledge base] section.
How to display
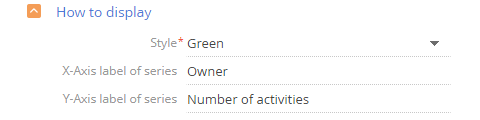
[Style] – select the color of the dashboard tile title and chart elements.
[Х-Axis label of series], [У-Axis label of series] – if a chart consists of more than one series, you can indicate the labels of X and Y axes for every series. These fields (Fig. 9) are only displayed for the charts that contain axes (“spline”, “line”, “area chart” and “scatter chart”).
Fig. 9 Setting up the [How to display] field group for a chart
Note
If you populate both the [X-axis label], [Y-axis label] as well as [Х-Axis label of series] and [У-Axis label of series] fields, a single-series diagram will display the values of the [X-axis label] and [Y-axis label] fields.
Displaying several series on a chart
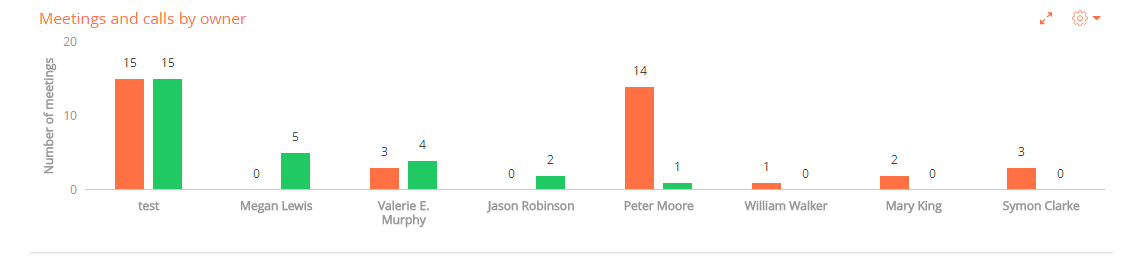
You can display several sets of data called “series” on your chart. For example, you can display meetings and calls of employees on separate series (Fig. 10).
Fig. 10 Example of a chart with two series
To add series to a chart:
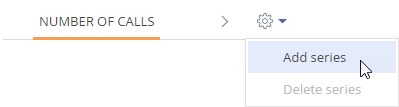
1.In the  button menu of the chart setup page, select the [Add series] command (Fig. 11).
Fig. 11 Adding a new series to a chart
2.On the new series tab, populate the required fields and save the page.
3.Save the chart setup page and the dashboard setup page that contains the chart.
As a result, the chart will display the new data series.
To delete series:
1.Select the series tab you want to delete.
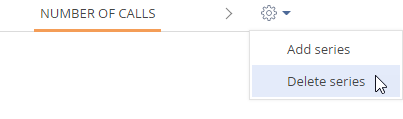
2.In the  button menu of the chart setup page, select the [Delete series] command (Fig. 12).
Fig. 12 Deleting a series from chart
Save the chart setup page and the dashboard setup page that contains the chart.
See also