Mobile application debugging
Glossary Item Box

Introduction
During the process of developing custom solutions for the bpm'online mobile application, you need to repeatedly perform application debug.
Mobile application is not an application of a hybrid type (mobile web application in the native shell) and you can debug it via Google Chrome Developer tools in the Mobile device mode. More information about debugging the application code via browser development tools can be found in the “Client code debugging“ article.
To launch a mobile application in the debug mode:
- Get the files necessary for debugging the mobile application.
- Launch the startchrome.bat.
- Enter the debug mode for mobile devices in the Google Chrome.
- Make the necessary settings and synchronize the mobile application bpm'online.
Getting the necessary files
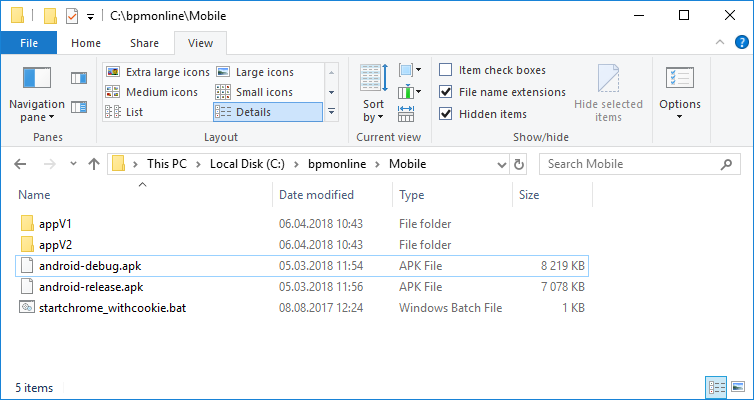
Contact the support team to get the files for debugging a mobile application. Support team will provide an archive with corresponding files. Extract archive to any folder (for example, C:\bpmonline\Mobile ) (Fig. 1).
Fig. 1. The contents of the unpacked archive
Launch of the startchrome_withcookie.bat
ATTENTION
Close Google Chrome application before you launch startchrome_withcookie.bat.
The startchrome_withcookie.bat is located in the root folder of unpacked archive. The Google Chrome will launch after executing the startchrome.bat.
When you first start the browser with the startchrome.bat, an information window will appear, warning you about saving the files to the file system (Fig. 2). Allow the saving of the files. Close the warning about the --disable-web-security unsupported file (Fig. 2).
Fig. 2. Information window with warning

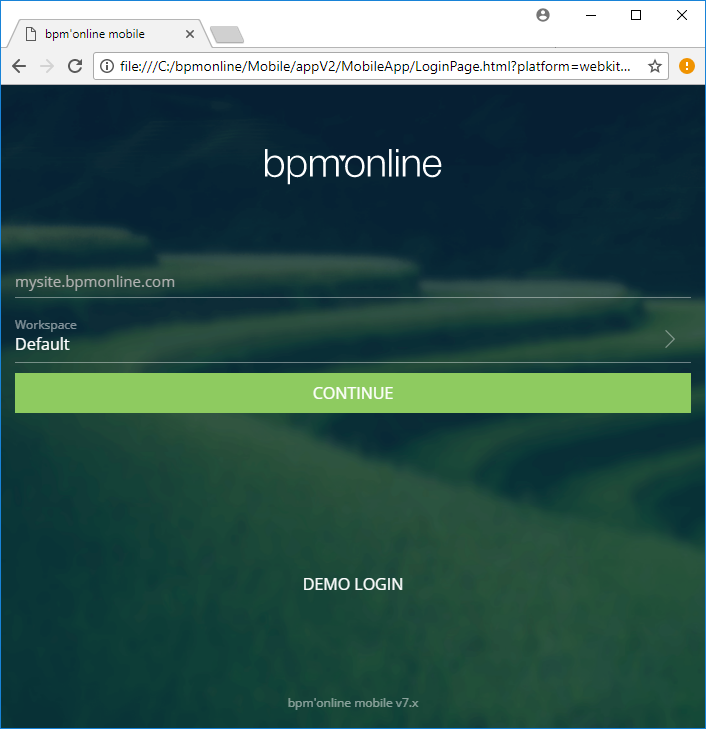
The execution of startchrome_withcookie.bat will launch the Google Chrome with the settings page of bpm’online mobile application (Fig. 3).
Fig. 3. Mobile application settings page
Switching to mobile application debugging mode
To access the developer tools in Google Chrome, press F12 key or Ctrl + Shift + I keys. You can debug the local version of the mobile application in the browser. More information about debugging application code via browser development tools can be found in the “Client code debugging“ article article.
NOTE
After switching to mobile device display mode, refresh the page by pressing F5 key.
Configuring and synchronization of the mobile application
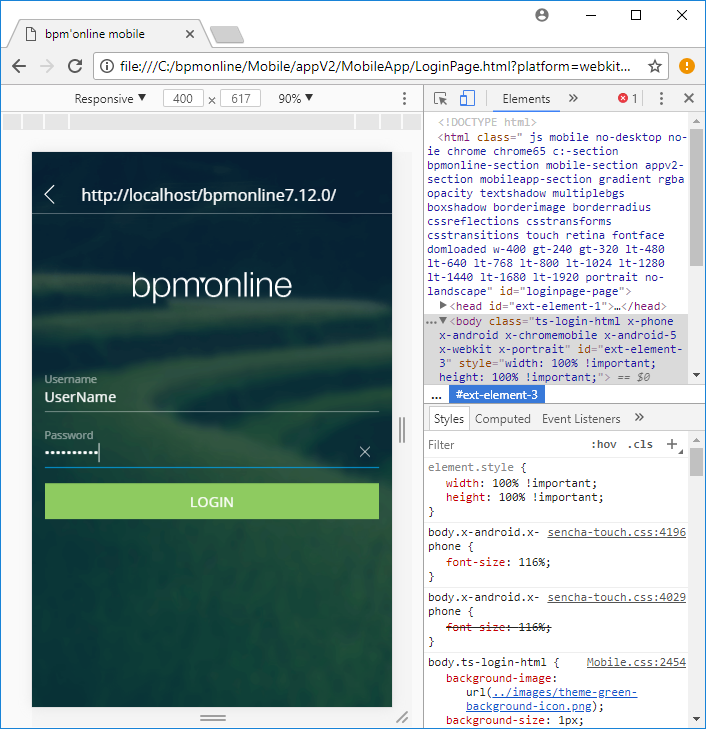
At first login to the mobile application, you need to enter the HTTP address of the bpm’online application on the settings page. To do this, you need to start debug process and click the [Continue] button (Fig. 4). After that, enter user name and password (Fig. 5).
Fig. 4. Settings page of the local mobile application

Fig. 5. Login page
After configuration and login, the local version of mobile application will behave as an application installed to the mobile device. The native functions of the mobile device (for example, working with the camera, downloading files, etc.) will not be supported. More information about working with mobile device in bpm'online can be found in the bpm'online mobile documentation.


