


Client code debugging
Glossary Item Box

Introduction
The client part of the Creatio application is represented by configuration schemas (modules), described in JavaScript language. Debugging of the source code of configuration schemas is executed directly from the browser. Developer tools that provide for debugging for all browsers, supported by Creatio, are used for this purpose.
To run tools for client debugging, execute the following command in a browser:
- Chrome: F12 or Ctrl + Shift + I.
- Firefox: F12.
- Internet Explorer: F12.
Possibilities for debugging of Creatio client code
All supported browsers provide mostly similar capabilities for debugging client code. Most common and frequently used debugging methods are listed below. For more details about debugging with browser tools, see the following documentation:
Scripts and breakpoints
You can view the full list of scripts, connected to the page and downloaded to a content by means of developer tools. Open any script to set a breakpoint in the place where you want to stop execution of a source code. In the stopped code, you can view current values of variables, execute commands etc.
To set a viewpoint, take the following actions:
- open necessary script file (for example, execute name lookup by combination of buttons Ctrl+O and Ctrol+P);
- go to code string where you want to set a breakpoint (for example, execute script lookup on the basis of method name);
- set a breakpoint by one of the following methods: click string name, press F9 button or select "Add breakpoint" item in right-click menu (cursor should be in the string, to which you want to add breakpoint).
You can also set a conditional breakpoint, for which you should set a condition for activation of the breakpoint.
You can also break an execution process directly from the code by the debugger command:
function customFunc (args) {
  ...
  debugger; // <-- debugger stops here.
  ...
}
Execution control
The debugging process is reduced to breaking of code execution at the breakpoint, verification of variable values and call stack. Code tracing is executed further for detection of fragments where program behavior deviates from predicted behavior.
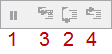
The following command is used in browser debuggers for code-based turn-by-turn navigation (figure 1, figure 2 and figure 3):
- suspend/continue script execution (1);
- perform step whithout entering the function (2);
- perform step whith entering the function (3);
- perform step before exiting from current function (4).
Fig. 1. — Navigation panel in Chrome browser debugger
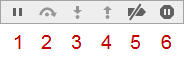
Fig. 2. — Navigation panel in Firefox browser debugger
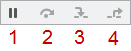
Fig. 3. — Navigation panel in Internet Explorer browser debugger
Chrome browser provides an additional two commands for execution control:
- deactivate all breakpoints (5);
- deactivate/activate automatic break in case of error (6).
For more information about possibilities and commands of navigation panel for a browser, see corresponding documentation.
Browser console use
In the course of debugging, you can execute JavaScript commands, display debugging, trace information, execute measurements and code profiling. The console object is used for this purpose.
JavaScript commands calling
To start operation of the browser console, you should open it by going to the [Console] tab or opening it in addition to the debugger, using the [Esc] button. You can then enter commands in javaScript and start their execution by pressing [Enter].
Debug information output
You can enable debugging information of a different nature, i.e. info messages, warnings and error messages, in the console. For this purpose you can use corresponding console object methods (table 1).
Table 1. — Console methods for output of debug messages.
| Method | Description | Chrome | Firefox | Internet Explorer |
|---|---|---|---|---|
| console.log(object [, object, ...]) | Outputs arguments in console and separate them with comma. Used for enabling different general messages. | + | + | + |
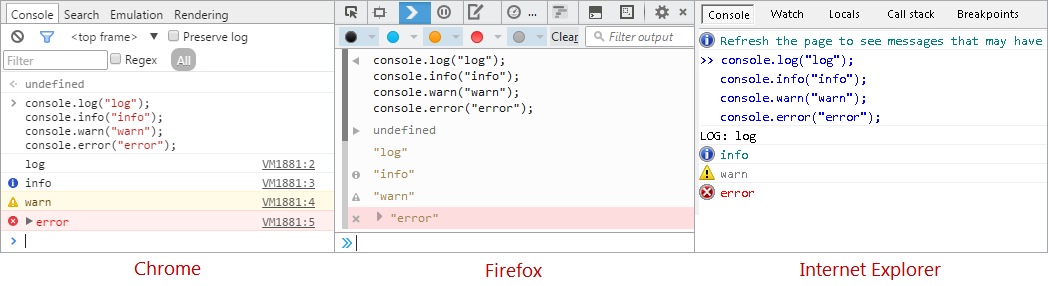
| console.info(object [, object, ...]) | Similar to log() method but outputs messages in other style (figure 4) and emphasizes their significance. | + | + | + |
| console.warn(object [, object, ...]) | Outputs warning message in console. | + | + | + |
| console.error(object [, object, ...]) | Outputs error message in console. | + | + | + (8+) |
An individual style is used for each type of outputted message (figure 4).
Fig. 4. — Styles of different types of console messages
The represented console methods support formatting of outputted messages. This means that you can use special controlling sequences (templates) that will be replaced by corresponding values (arguments, additionally transferred to the function).
Console methods support the following formation templates (table 2).
Table 2. — Console message formation templates
| Template | Data type | Example of use |
|---|---|---|
| %s | String | console.log("%s is one of flagship products of a company %s", "Sales Creatio", "Terrasoft"); |
| %d, %i | Number | console.log("Platform %s was issued for the first time ever in %d year", "Creatio", 2011); |
| %f | Float | console.log("Pi character is equal to %f", Math.PI); |
| %o | DOM-item (it is not supported by IE) | console.log("DOM-View of item <body/>: %o", document.getElementsByTagName("body")[0]); |
| %O | JavaScript Object (is not supported by IE and Firefox) | console.log("Object: %O", {a:1, b:2}); |
| %c | CSS style (is not supported by IE) | console.log("%cGreen text, %cRed Text on a blue background, %cCapital letters, %cPlain text", "color:green;", "color:red; background:blue;", "font-size:20px;", "font:normal; color:normal; background:normal"); |
Tracing and validations
Table 3 shows console methods for tracing and verification of expressions.
Table 3. — Console methods for tracing and verification
| Method | Description | Chrome | Firefox | Internet Explorer |
|---|---|---|---|---|
| console.trace() | Outputs call stack from code point where method was called. Call stack includes file names, string numbers and also call counters of trace() method from one and the same point. | + | + | + (11+) |
| console.assert(expression[, object, ...]) | Verified expression, transferred as an expression parameter and, if the expression is false, outputs error with (console.error ()) call stack in the console, otherwise it outputs nothing. | + | + (28+) | + |
Console.trace() method outputs informative stack-trace with full list of functions and their arguments at the moment of call.
Due to the console.trace() method you can comply with rules in the code and ensure that code execution results meet expectations. Using console.assert () you can execute code testing, i.e. if execution result is unsatisfactory, the corresponding value will be discarded.
An example of the console.assert() method for testing of results:
var a = 1, b = "1";
console.assert(a === b, "A is not equal to B");
Profiling and measurement
You can measure code execution time with browser console methods (table 4).
Table 4. — Console methods for measurement of code execution time
| Method | Description | Chrome | Firefox | Internet Explorer |
|---|---|---|---|---|
| console.time(label) | Starts counter (milliseconds) with label. | + | + | + (11+) |
| console.timeEnd(label) | Stops counter (milliseconds) with label and plans result in console. | + | + | + (11+) |
An example of console.time() and console.timeEnd() methods in code:
var myArray = new Array();
// Starts counter with Initialize myArray tag.
console.time("Initialize myArray");
myArray[0] = myArray[1] = 1;
for (i = 2; i<10; i++)
{
    myArray[i] = myArray[i-1] + myArray[i-2];
}
// Stops counter with Initialize myArray tag.
console.timeEnd("Initialize myArray");
You also can execute code profiling and output profiling stacks that contain detailed information about how much time was spent by a browser for definite operations.
Table 5. — Console methods for code profiling
| Method | Description | Chrome | Firefox | Internet Explorer |
|---|---|---|---|---|
| console.profile(label) | Runs Java Script profiler and displays results, marked with label. | + | + (when DevTools panel is opened) | + (10+) |
| console.profileEnd(label) | Stops Java Script profiler. | + | + (when DevTools panel is opened) | + (10+) |
- Chrome — Profiles tab:
- Firefox — Performance tab;
- Internet Explorer — Profiler tab.