Back-end debugging is debugging of C# code schemas, for example, existing base schemas, custom configuration classes, web services, etc.
Execute back-end debugging
Debug the C# code schemas using the integrated debugging functionality of external IDEs, for example, Visual Studio Code.
External IDE debuggers let you execute the following actions:
- suspend the execution of methods
- check the values of variables
- change the values of variables
View an example that executes back-end debugging in the Visual Studio Code external IDE below.
To execute debugging in Visual Studio Code, ensure the following requirements are met:
- Use Creatio on-site.
- Turn off the file system development mode.
- Select the Suppress JIT Optimization checkbox in Visual Studio Code (Options menu → Debugging item → General block). The checkbox lets you control the values of variables while debugging. Learn more about the impact of optimized and unoptimized code on debugging in the official Visual Studio documentation.
To execute back-end debugging:
- Export the C#-code schemas to the local directory files.
- Create a Visual Studio Code project for debugging.
- Add the exported files to the Visual Studio Code project.
- Connect the project to the IIS server workflow and execute debugging.
Solve debugging issues
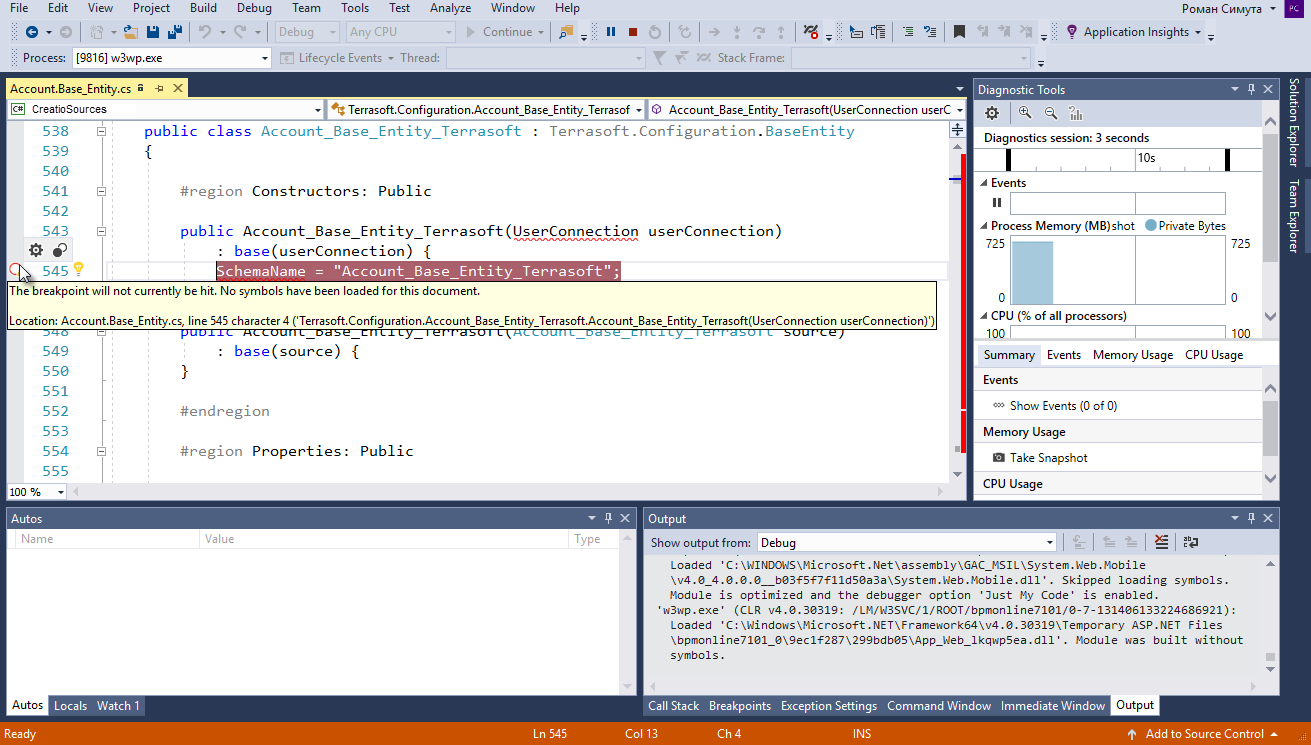
Solution:
- Stop debugging (Debug menu → Stop Debugging item).
- Close the file that contains the debugged source code.
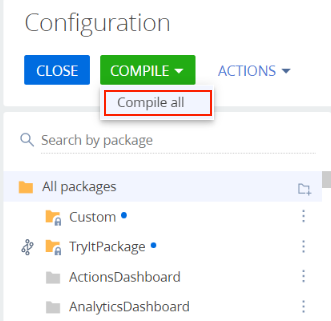
- Execute the Compile all action in the Configuration Creatio section.
- Reconnect the project to the IIS process when compiling and reexporting the source code files.
- Reopen the debugged source code file after the compilation finishes.
You can also recompile code without closing the file and reconnecting the project to the IIS process.
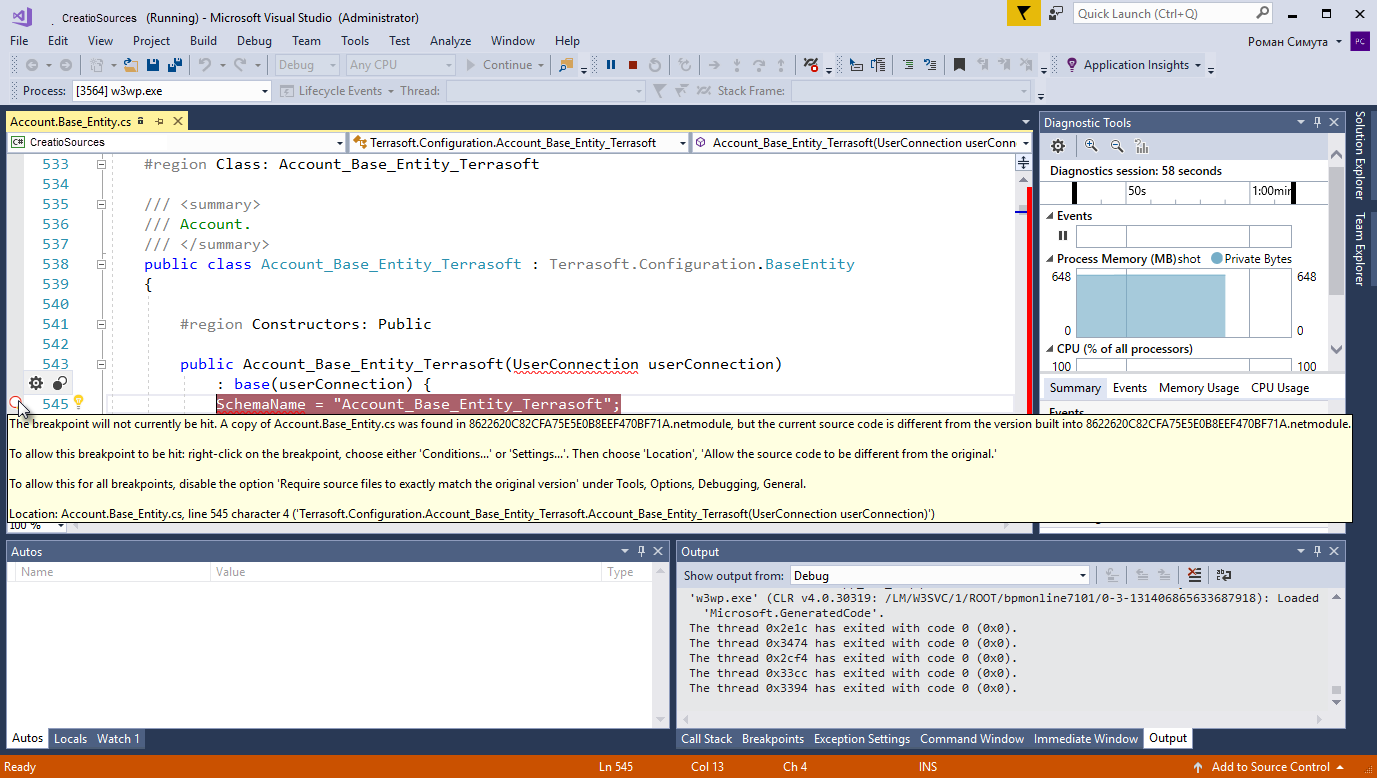
Solution:
- Click No to cancel character normalization. If you click Yes to normalize the characters, the breakpoint might become inactive again.
- Execute one of the suggested solution options from the tooltip that also specifies the cause of the issue (file version mismatch).
1. Export the C# code schemas to the local directory files
-
Modify the Creatio configuration files to debug C# code.
-
Set the debug attribute of the <compilation> element to true in the Web.config configuration file located in the Creatio root directory.
Save the file.
-
Set the following values in the Web.config configuration file located in the ...\Terrasoft.WebApp directory:
- Set IncludeDebugInformation to "true."
- Set ExtractAllCompilerSources to "true" (if you need to export all schemas while executing the Compile action in the Configuration section) or "false" (if you need to export only modified schemas, the default value).
Save the file.
-
-
Execute the Compile all action in the Configuration section.
As a result of compilation, Creatio will export the files that contain the source code of configuration schemas to the ../Terrasoft.WebApp/Terrasoft.Configuration/Autogenerated/Src directory. For example, configuration libraries, their modules, and files that contain debugging information (*.pdb files). Creatio exports the source code of schemasupon each compilation.
The file names of exported schemas follow this pattern: SchemaNameInConfiguration.PackageName_SchemaType.cs, for example, Contact.Base_Entity.cs, ContractReport.Base_Report.cs.
2. Create a Visual Studio Code project for debugging
To create a Visual Studio Code project for debugging:
-
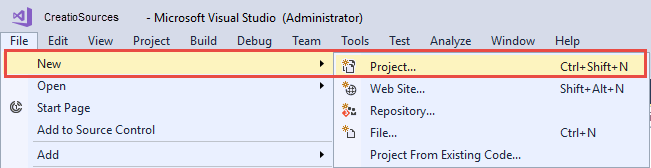
Click File → New → Project on the Visual Studio toolbar.
-
Fill out the project properties:
- Select the "Class Library (.NET Framework)" project type.
- Enter the project name.
- Enter the project location.
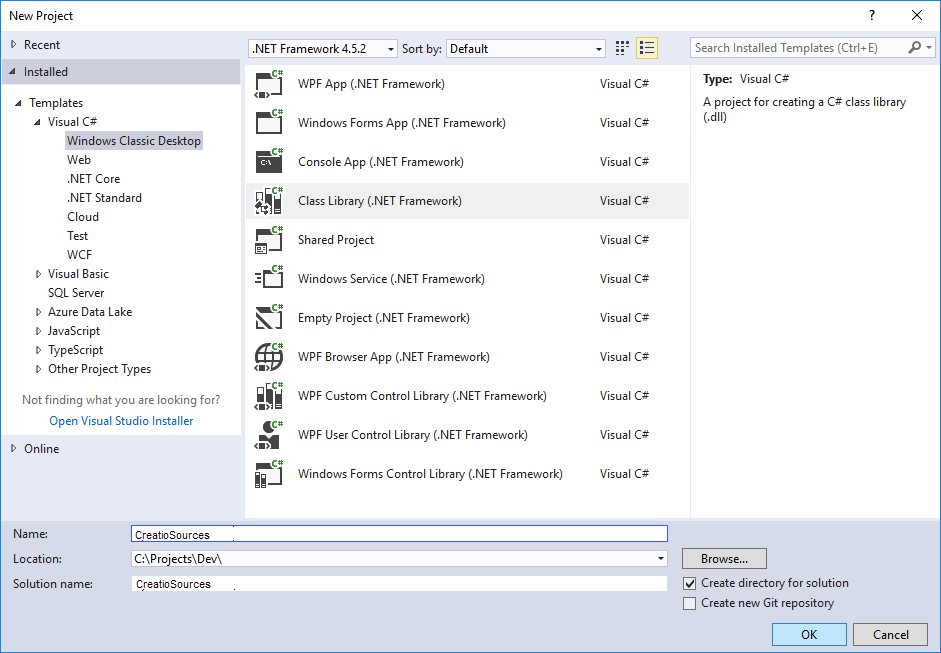
- Delete the Class1.cs file from the project after creating it and save the project.
3. Add the exported files to the Visual Studio Code project
- Click Add → Existing Item in the context menu of the project in the solution explorer.
-
Select all files in the exported files directory.
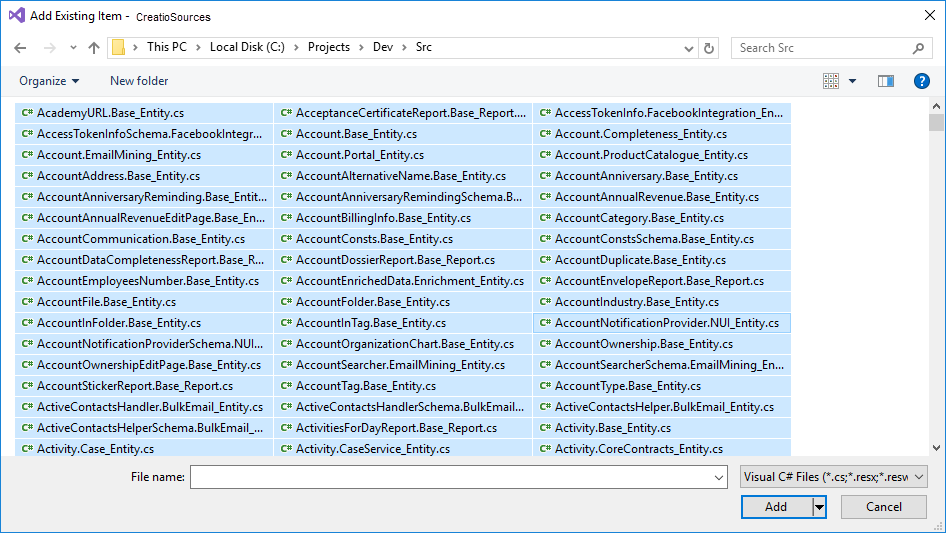
- Save the project.
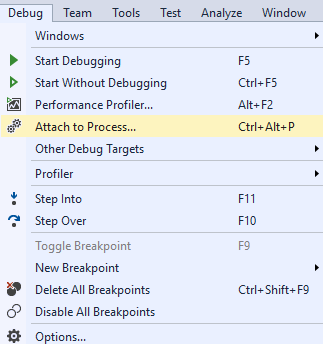
4. Connect the project to the IIS server workflow and debug code
-
Click Debug → Attach to process on the Visual Studio toolbar.
-
Select the IIS workflow where the Creatio instance pool runs from the process list.
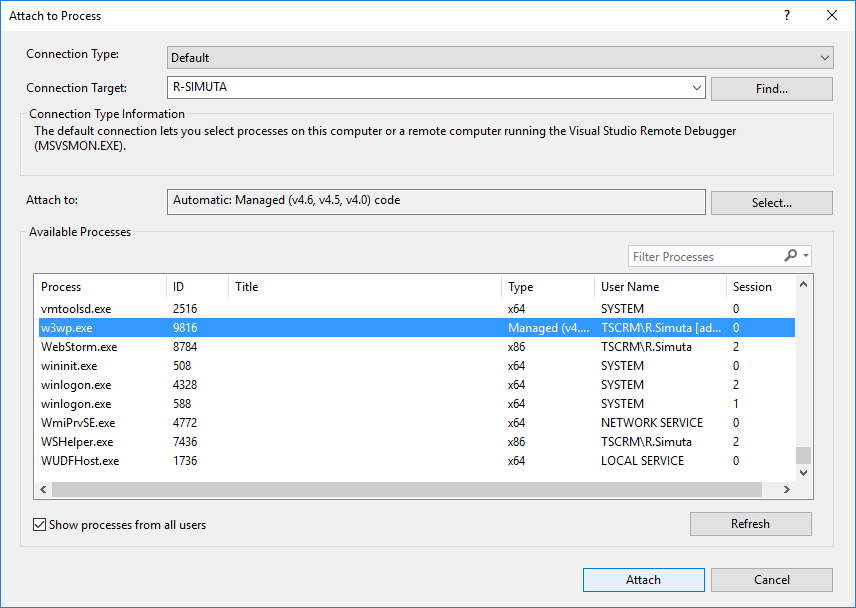
By default, IIS runs the working process as the account whose name matches the name of the application pool. To display processes from all users, select the Show processes from all users checkbox.
-
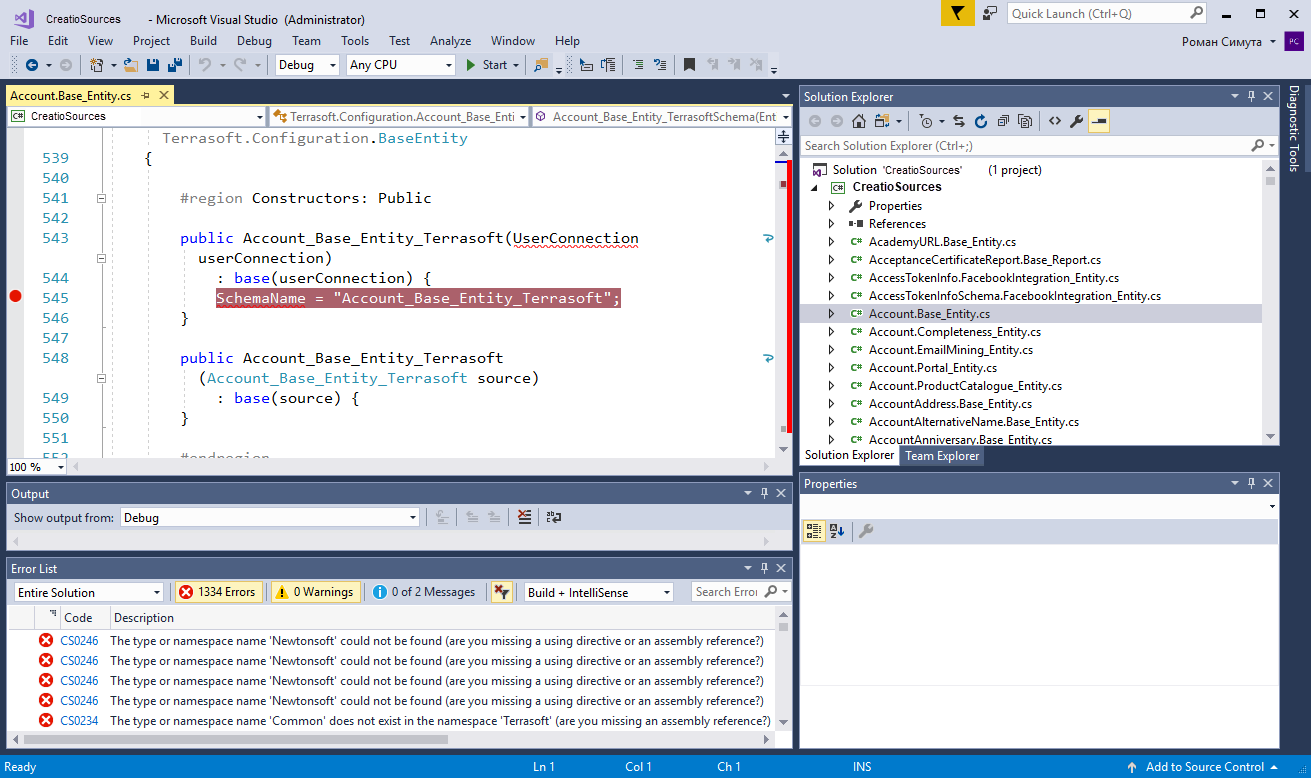
Open the source code file and set a breakpoint.
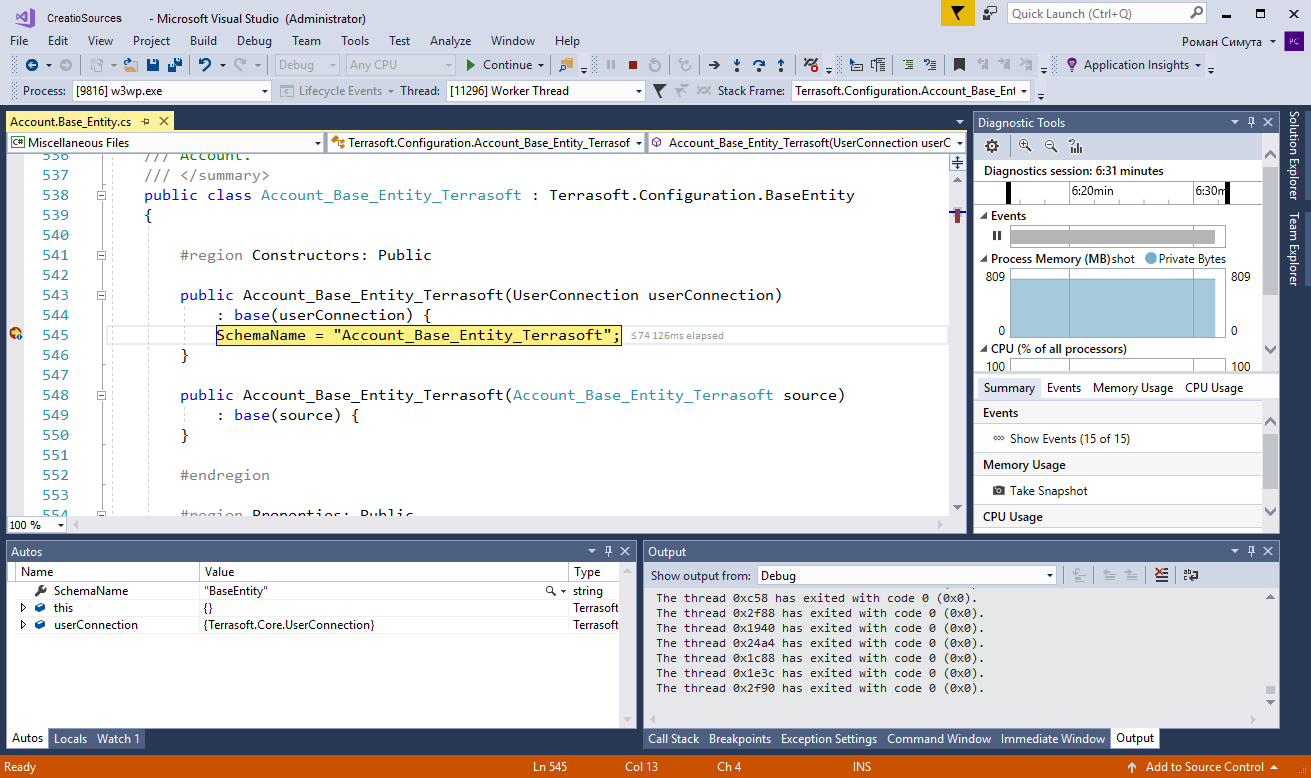
As soon Visual Studio Code runs the method that has a breakpoint set, the program execution is stopped. You can check the current state of the variables and trace the code after stopping.