


Charts
Glossary Item Box

General information
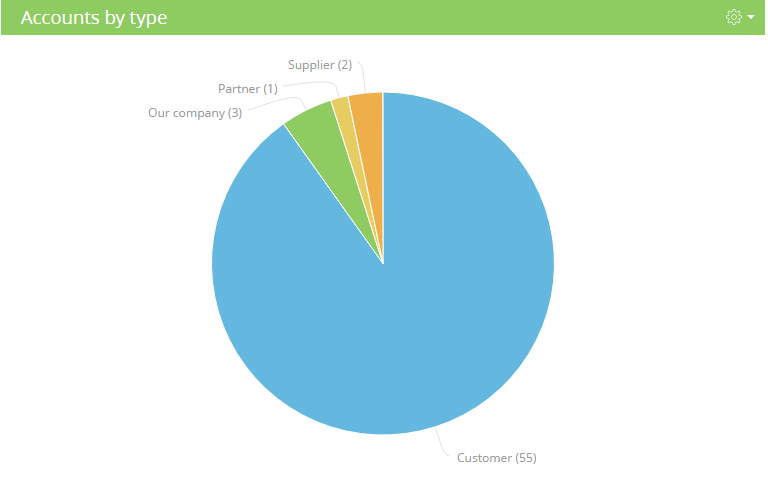
Charts display multiple system records in the form of diagrams of different types. For example, you can display a pie chart of accounts distributed by type. Charts display information in the form of different diagram types or in a data list form. Learn more about charts in the “The “Chart” dashboard component” article. Chart settings are described in the How to set up a “Chart” dashboard component article.
The “Charts” dashboard
Charts functionality implementation classes
ChartViewModel – chart view model.
ChartViewConfig – generates the chart view model.
ChartModule – a module designed to work with charts.
ChartDesigner – view model schema of a chart.
ChartModuleHelper – generates a query using the Terrasoft.EntitySchemaQuery object.
ChartDrillDownProvider – contains methods for working with the “Show data” function (used for working with chart series).
Chart setup parameters
To configure a chart, you need to add the JSON configuration object with the chart properties to the widget module configuration. The widget module configuration is defined by the Items property of the SysDashboard object. Learn more about the SysDashboard object and its properties in the “Dashboard widgets” article.
Set the “Chart” value to the widgetType property in the JSON configuration object with widget settings. In addition, assign the parameters property to the object with necessary parameters. Possible chart parameters are listed in table 1.
Table 1. Chart setup parameters
| Name | Type | Details |
|---|---|---|
| seriesConfig | object | The settings of an embedded chart in a series. |
| orderBy | string | Sorting field. |
| orderDirection | string | Sorting direction. |
| caption | string | Chart header. |
| sectionId | string | Section id. |
| xAxisDefaultCaption | string | Default X-axis header. |
| yAxisDefaultCaption | string | Default Y-axis header. |
| primaryColumnName | string | Name of initial column. The “id” column is the default one. |
| yAxisConfig | object | Array of the Y-axis name settings. |
| schemaName | string | Chart object. |
| sectionBindingColumn | string | Section link column. |
| func | string | Aggregate function. |
| type | string | Chart type. |
| XAxisCaption | string | X-axis caption. |
| YAxisCaption | string | Y-axis caption. |
| xAxisColumn | string | The X-axis grouping column. |
| yAxisColumn | string | The Y-axis grouping column. |
| styleColor | string | Chart color. |
| filterData | object | Filter settings. |