IsDebug mode
Glossary Item Box

Introduction
You need the ‘isDebug’ mode for getting detailed data about errors and tracing them in the source code. You can debug the source code using built-in browser tools. For more information about the built-in developer tools, please see the "Client code debugging" article.
In the normal mode, the code in the browser is minified. This means that the client scripts are compiled in the all-combined.js file that contains the core functionality. The file is updated during the build compilation. The ‘isDebug’ mode disables compilation and compression of the core JS files and allows retrieving the client scripts as a series of individual files.
ATTENTION
The ‘isDebug’ mode is implemented in version 7.13.0 and up.
Enabling the client debugging mode
To check the current status of the client debugging mode, open the browser console (fig. 1) by pressing the F12 key or pressing Ctrl+Shift+I. Aside from the current status of the client debugging mode, the console will display the code to enable or disable debugging.
Fig. 1. – ‘isDebug’ mode status

You can enable the client debugging mode using the following methods:
-
Execute the following code in the browser console:
Terrasoft.SysSettings.postPersonalSysSettingsValue("IsDebug", true)
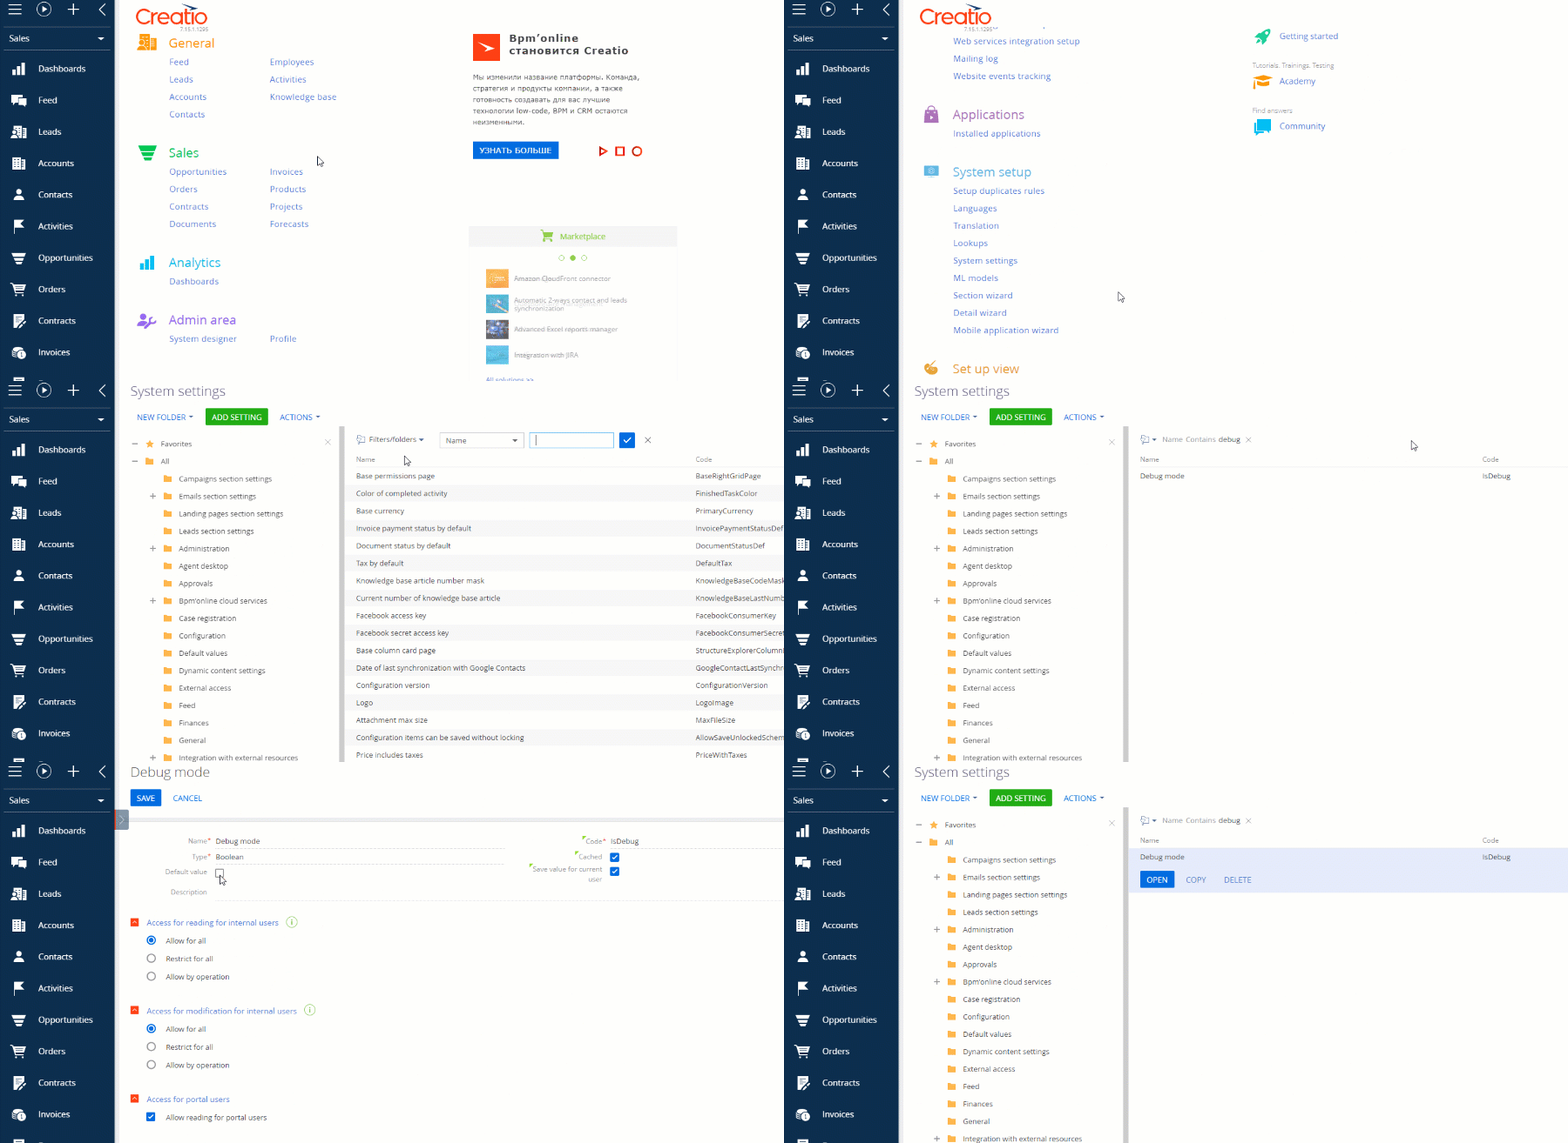
- Change the value of the [Debug mode] system setting (fig. 2).
Fig. 2. – Changing the ‘isDebug’ system setting value

To apply the changes, refresh the page or hit F5.
Upon activating the client debugging mode, you will see the Debug indicator next to the site’s version number.
Fig. 3. – The client debugging mode indicator

NOTE
Enabling the client debugging mode will affect site performance. For instance, it can increase the time needed for the pages to load.
Example. The browser console displaying the error details.
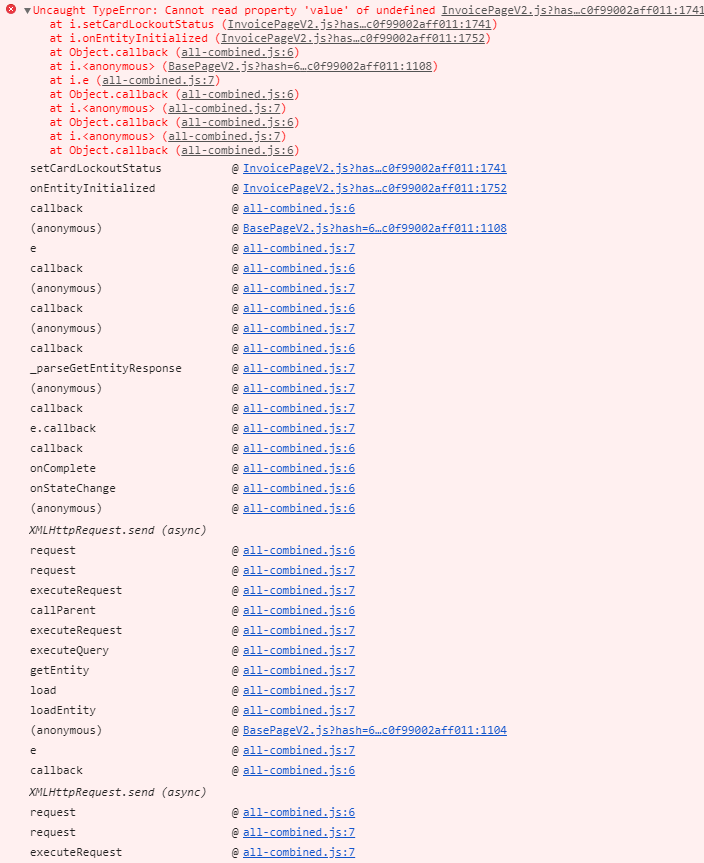
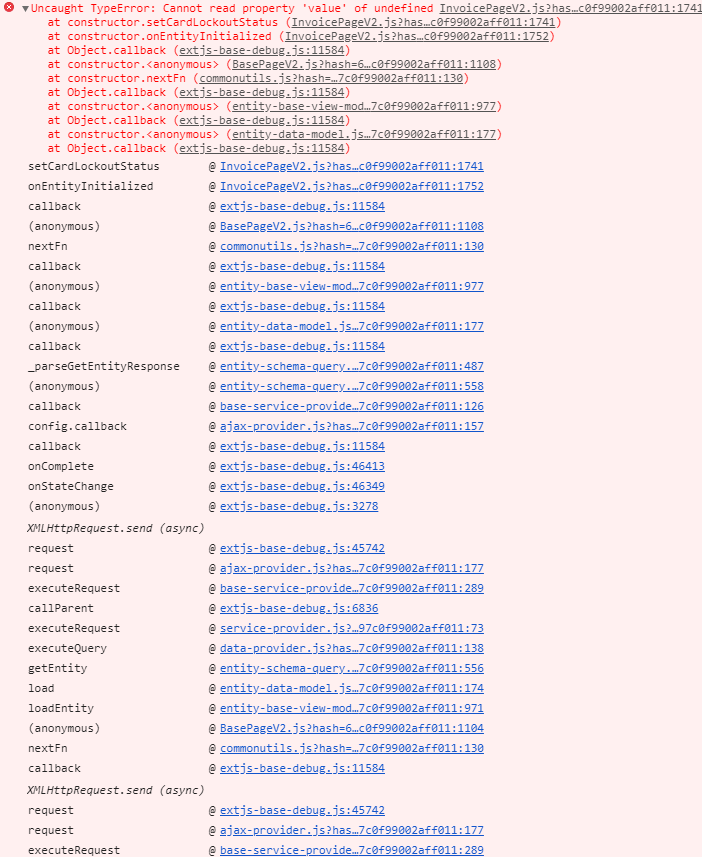
The figures below show examples of errors displayed in the console with the ‘isDebug’ mode disabled (fig. 4) and enabled (fig. 5).
Fig. 4. – Displaying an error (‘isDebug’ disabled)

Fig. 5. – Displaying an error (‘isDebug’ enabled)


