


Report designer workspace
Glossary Item Box

Overview
ATTENTION
A Zip archive with the report designer can be downloaded via this link https://academy.bpmonline.com/sites/default/files/documents/downloads/ReportDesigner/ReportDesigner_7_10_en.zip
The workspace of the report designer (Fig. 1) consists of several functional areas and contains tools that are necessary for creating reports.
Fig. 1. Report designer workspace
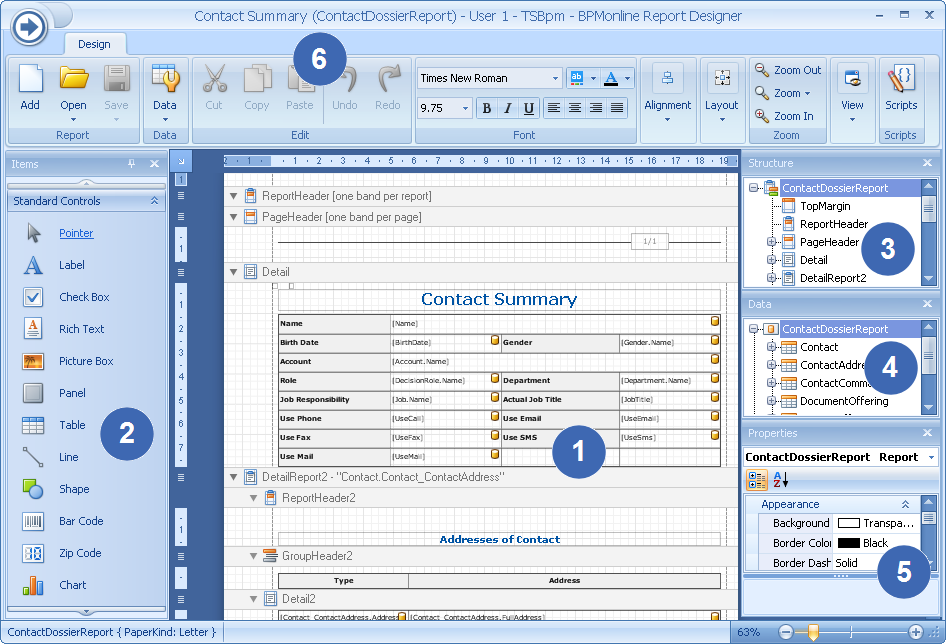
Report layout area (1)
This area is the breadboard layout of the report page. Any element from the [Items] window can be placed on this area.
The [Items] window (2)
The window contains a list of elements that can be added to the report page (labels, picture boxes, charts, page breaks, etc.).
NOTE
The position of the [Items], [Structure], [Data] and [Properties] windows can be arbitrary in the designer workspace. In addition, some windows can be hidden. Click the [Windows] button and select a corresponding window to display or hide it.
The [Structure] window (3)
The window displays a tree-like structure of elements that were added to the report.
The [Data] window (4)
The window displays the structure of the report source data. For example, this area can display bpm’online section columns. Columns displayed in the [Data] window can be placed to the report designer area.
The [Properties] window (5)
The window displays individual characteristics of the selected report element. Values of the properties can be modified.
The ribbon (6)
Ribbon is a set of toolbars at the top of the report designer workspace. Ribbon helps to find commands to perform tasks.
The [Report] toolbar
The [Report] tollbar is used to create, edit and save reports (Fig. 2). Description of the commands of the [Report] toolbar is given in the Table 1.
The [Report] toolbar
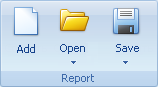
Table 1. Commands of the [Report] toolbar
| Command | Description |
|---|---|
| Create | Creates a new report If another report was opened when the [Create] button was clicked, you will receive a warning message to save the opened report before creating a new one. The report will be saved under its current name. |
| Open |
Opens the selected report in the designer. Button menu contains the following items:
|
|
Save |
Saves the report. Button menu contains the following items:
|
The [Data] toolbar
Connection of the report with objects and database is carried out via report data source. The report data source may include columns of system objects and additional custom columns. For example, to add a list of accounts and their industries to the report, the data source must contain the [Name] and [Industry] columns of the [Account] object.
The report data source is created with the [Data] toolbar (Fig. 3).
Fig. 3. [Data] toolbar

The [Data] button menu contains the following commands:
- [Select Objects] – opens the [Objects for Report] window to select object columns. Data of these columns will be used to create a report.
- [Load from file] – loads the report data source from the .xsd file.
- [Save to file] – saves current report data source to the .xsd file. For example, to edit the data source outside the report designer.
The [Objects for Report] window will open by clicking the [Data] button.
NOTE
Before start the [Select Object] command, select a custom bpm’online package in the [Package] report property. The report will be saved to this package. For example, this can be the [Custom] package.
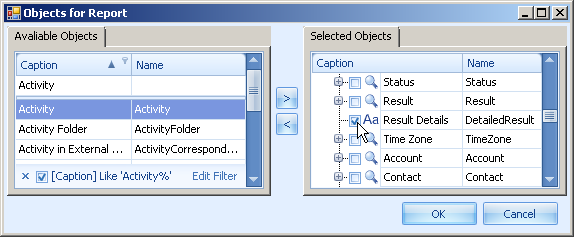
The [Objects for Report] window
The [Objects for Report] window (Fig. 4) is used to add configuration object columns to the report data source.
Fig. 4. [Objects for Report] window

The [Available objects] area
The [Available objects] area contains a list of system objects, the information from which can be used to build the report.
The string under the [Title] and [Name] is used for search of the objects. Enter a part of the name or a title to filter objects (Fig. 5). Filter conditions that were applied to the area will be displayed in a separate string.
Fig. 5. the [Available objects] area with applied filter
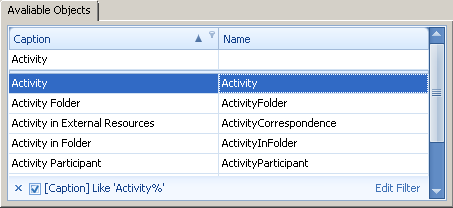
To configure filter conditions click the [Edit filter] link. To disable filter without deleting filter conditions, disable the filter checkbox. Click the  button to clear the filter.
The [Selected objects] area
The [Selected objects] area displays structure of object columns that were added to the current report.
Click the  button to add an object to the [Selected objects] area or click the
  to remove the object. For each object you need to specify columns to be added to the report data structure.
Enable the checkbox at the left of the object column to add it to the data source.
Fig. 6. Adding object column to the report data source
For example, if the report will contain names and main contact addresses, you need to add the [Contact] object and enable checkboxes for the [Name] and [Address] columns in the [Selected objects] area.
The data structure tree in the [Selected objects] area contains information of the connected data. If an object column connects it with other object, it will contain all structure of columns of the connected object and will be marked in the structure of the current object with the ![]() icon. For example, for the [Contact] object it will be the [Owner] column.
icon. For example, for the [Contact] object it will be the [Owner] column.