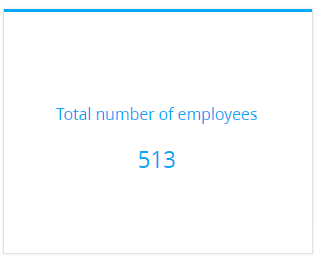
The “Metric” dashboard tile (Fig. 1) displays a calculated numeric value or a date according to specific Creatio data, for example, total number of employees per department.
Fig. 1 “Metric” dashboard tile

Metrics can display the following data types:
-
The total number of either all or filtered records of a system object, for example, the number of all Creatio contacts.
-
Minimum or maximum value of a numeric field or a date field, for example, minimum or maximum call duration.
-
Sum or the average value of a numeric field, for example, the total amount of paid invoices.
Setting up the “Metric” dashboard tile
A metric setup page will open when you add or edit the “Metric” dashboard tile on a dashboard panel. You can set up the primary metric parameters here – data, title, and display conditions.
[Title] – the name that will be displayed on the dashboard for this tile.
What to display
[Object] – Creatio object whose data must be displayed in the metric.
[Function] – the type of value that should be displayed on the tile. The following functions are available:
-
“count” – number of object records, for example, total number of employee records in Creatio.
-
“sum” – the sum of values by column, for example, total duration of employees' calls.
-
“average”, “minimum”, “maximum” – respective values by column, for example, the average duration of employees' calls (the “average” function is not available for date fields).
[Column] – the column to be used in the calculation. The list includes numeric columns and date columns. For example, specify the “Duration (minutes)” value to calculate the average duration of calls by managers (Fig. 2). This field is not displayed if the “count” value is selected in the [Function] field.
Fig. 2 Setting up the [What to display] detail for an indicator

How to filter
Use standard filter to select records for calculation of the metric value. For example, you can display the average duration of calls made by employees for the previous month only via the following filter conditions: “Created on = Previous month” (Fig. 3).
Fig. 3 Setting up the [How to filter] detail for metric

The filter is available if the [Object] field is populated.
Note
You can find more information about the advanced filter in a separate article.
How to associate with section data
[Connect ... object with ... section by field] – populate the field if you want to display the data only for records currently displayed in the section list. If you leave this field empty, the filters applied in the section will not be considered when calculating the indicator value. The field is displayed if the [Object] field is populated, but it is not displayed when yo uset up a metric in the [Dashboards] section.
Different cases of using this field are covered in the “Chart” dashboard tile description. Read more >>>
How to display
[Style] – the color of the title and metric value.
[Font size] – the metric text size – “Default” or “Large”.
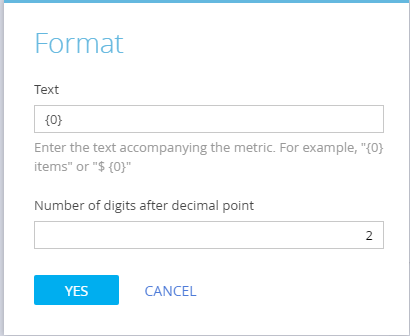
[Format]] – the display format for the metric. The display format is set up in the additional window (Fig. 4). To open the window, click  .
.
Fig. 4 Metric display format window

[Text] – the text accompanying the metric. For example, if the metric should be “Total employees: 513”, where 513 is the actual calculated metric, enter the following value in the [Text] field: “Total employees: {0}”. If the format should be “513 employees”, enter the mask value: “{0} employees”
Note
If you insert the variable incorrectly, the numeric value will not be displayed on the tile. To restore the variable, clear the field and save changes in the window.
[Number of digits after decimal points] – accuracy of the fractional part of the metric. For example, set the “1” value to display the metric number with one digit after decimal point. To display the digit without the fractional part, set the number of digits to “0”.
See also
•The “Sales pipeline” dashboard tile


