


Add dashboards as page widgets
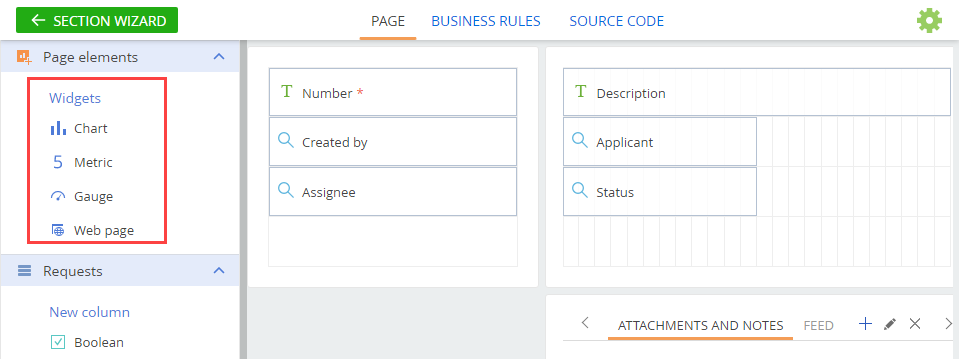
You can configure displaying of dashboard tiles on any record page tab or in the record profile. Learn more about Creatio dashboards in the “Dashboards” article. For this, use the “Widgets” page elements (Fig. 1) available on the left-side panel of the Page Designer.
Fig. 1 Widget area in the Page Designer
You can add the following types of dashboards on a record page:
Note
More information about setting up different types of dashboards is available in the “Dashboards” article.
Case
Create a chart that would display the dynamics of communication with a customer on the [History] tab of the contact page.
To add a chart on the contact page:
1.Open the [Contacts] section.
2.Click [View] -> [Open Section Wizard].
Note
If you need to add dashboards on a detail page, use the Detail Wizard instead of the Section Wizard.
3.In the “Section pages” block of the Section Wizard:
• if you have only one edit page in your section, click [Edit page];
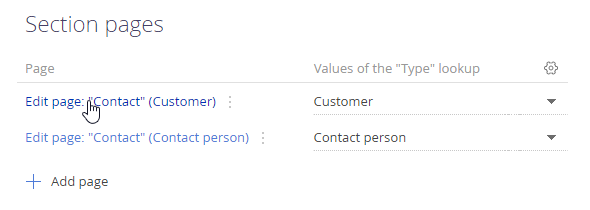
• if you have several edit pages in your section, click the link of a corresponding page in the list (Fig. 2)
Fig. 2 Selecting a section edit page from the list
4.In the Page Designer that opens, click the [History] tab (Fig. 3). This tab will display your diagram.
Fig. 3 Switching to the [History] tab

5.Add a new “Dynamics of communication” field group. Place the field group at the top of the [History] tab page. This field group will contain the newly created diagram.
6.Expand the [Page elements] block and drag the needed widget on the page. For example, drag-and-drop the [Chart] widget to the new [Dynamics of communication] field group. Areas, where you can place the chart, will be highlighted in blue (Fig. 4).
Fig. 4 Adding a chart on the contact page
7.On the opened chart setup page, populate the first series of the chart that would display the number of calls of the contact for the needed period, e.g., the previous quarter. Learn more about displaying several series of data on one dashboard in the “Displaying several series on a chart” block of the “Setting up the “Chart” dashboard tile“ article. Set the parameters as follows:
Fig. 5 Setting up the “Calls and emails for the previous quarter” chart
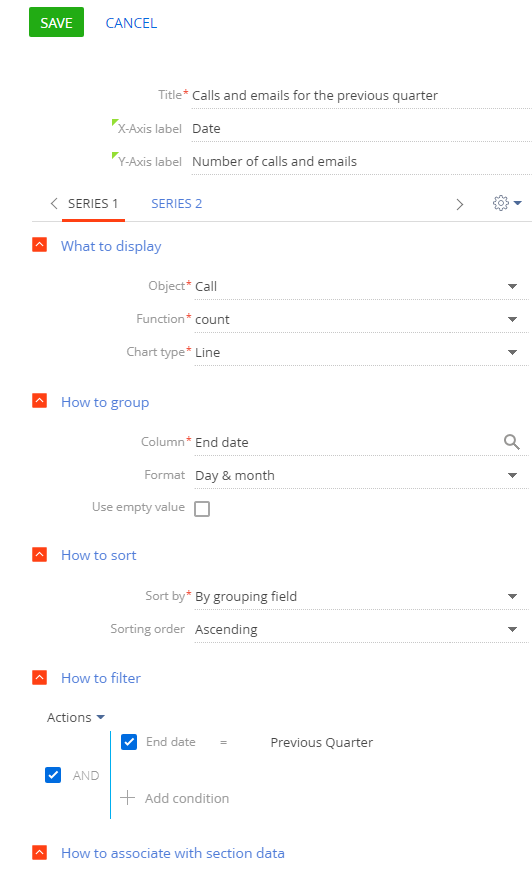
a.[Title] – “Calls and emails for the previous quarter”
b.[X-Axis label] – “Date”
c.[Y-Axis label] – “Number of calls and emails”
d.[Object] – “Call”
e.[Function] – “Count”
f.[Chart type] – “Line”.
g.[How to group] – set grouping by the “End date” column for calls.
h.[Format] – “Day & month”
i.[How to filter] – Specify the “End date = Previous quarter” for calls.
j.[How to associate with section data] – Specify “Id” to display the data for the selected contact only.
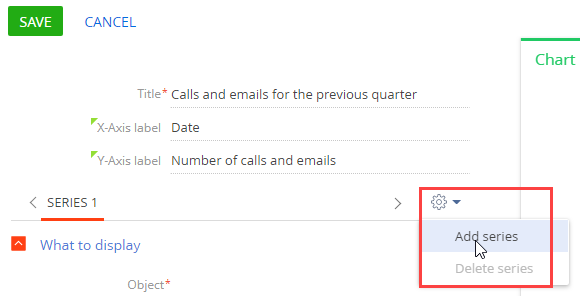
8.Add another series to your chart widget by clicking  and selecting the “Add series” option (Fig. 6).
Fig. 6 Adding series to a chart widget
9.Populate the properties of the second series:
a.[Object] – “Activity”
b.[Function] – “Count”.
c.[Chart type] – “Line”.
d.[How to group] – set grouping by the “Due” column for activities.
e.[Format] – “Day & month”
f.[How to filter] – “Type = Email” and “Due = Previous quarter.”
g.[How to associate with section data] – Specify “Id” to display the data for the selected contact only.
10.Click [Save] to apply changes.
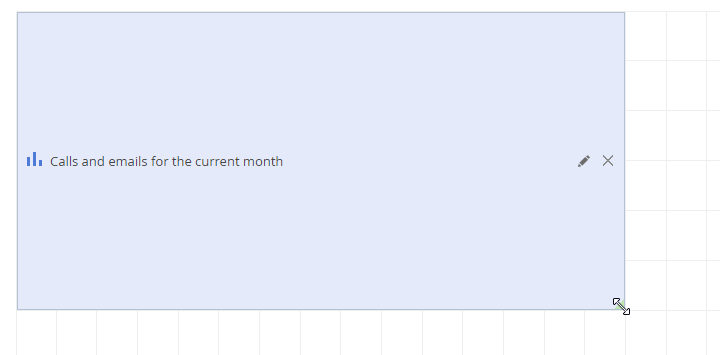
11.For the correct displaying of data, adjust the size of the chart (Fig. 7).
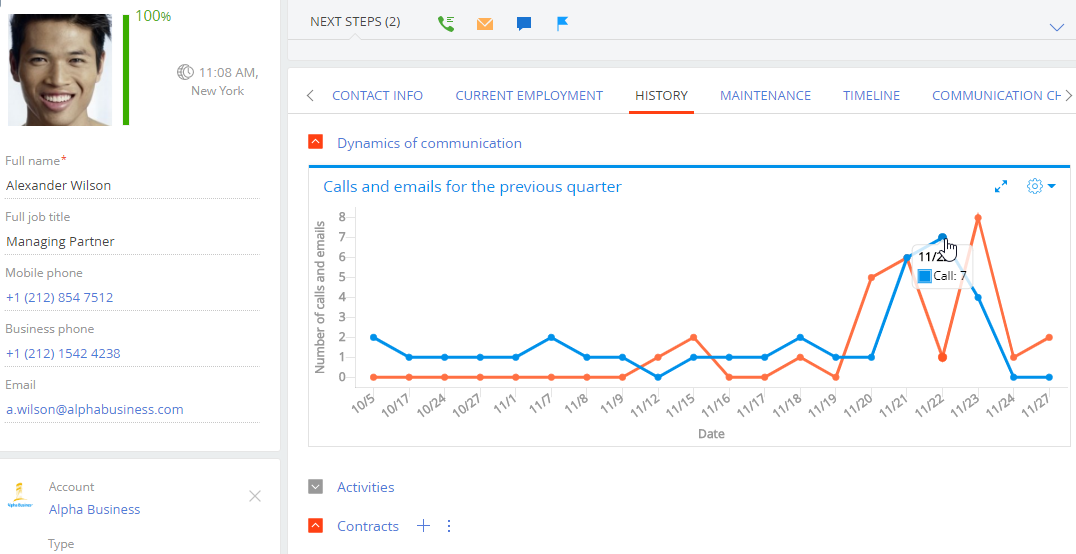
As a result, the chart showing the dynamics of communication with the contact for the previous quarter will be displayed on the contact page (Fig. 8).
Fig. 8 Record page with a configured chart widget
Note
Learn more about configuring charts in the “Chart” dashboard tile” article.
See also
Video tutorials