Set up a pivot table
This functionality is available for Creatio 10.1 and later.
To use the functionality in Creatio version 10.0, turn on the EnableFreedomUIPivotTable additional feature. Learn more: Manage an existing additional feature.
Use a pivot table to analyze object data by multiple dimensions at once directly on a Freedom UI page. The Pivot table widget groups records by object columns along the rows and columns of the grid and calculates values at their intersections.
To set up a pivot table:
- Add the widget to a page. Read more >>>
- Set up rows, columns, and values. Read more >>>
- Add a calculated field. Optional. Read more >>>
- Filter the pivot table data. Optional. Read more >>>
- Save the page. Read more >>>
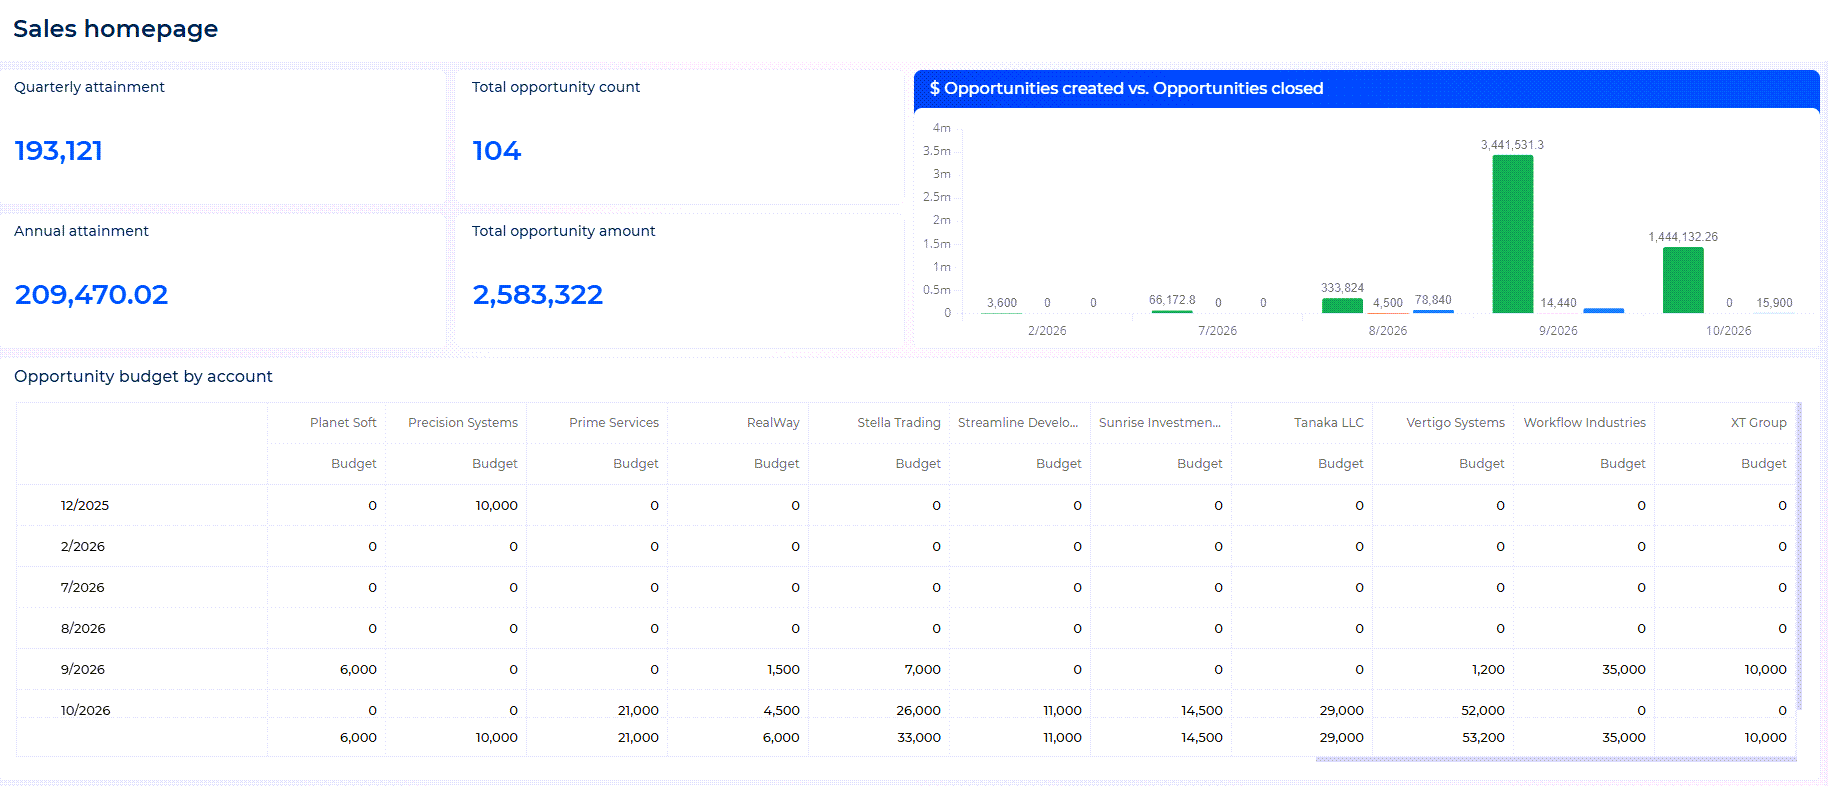
Add a pivot table to the "Sales" homepage. The pivot table displays the total budget of opportunities grouped by account and by year and month.
1. Add the widget to a page
-
Open the "Sales" homepage in Freedom UI Designer. To do this, click Home → Edit page.
-
Drag the Pivot table widget from the Widgets group of the Components tab to the canvas.
-
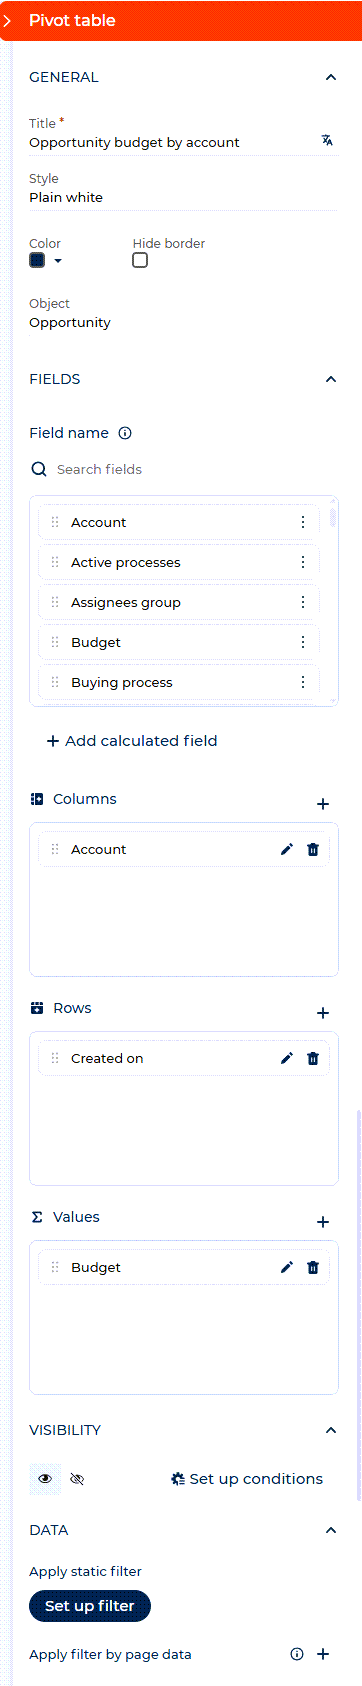
Fill out the General block of the setup area.
Field name
Field value
Title
The widget title displayed on the page.
Style
The widget style. Available values: "Plain white," "Fully colored," "Partially colored," "Glass effect." Out of the box, the widget uses the "Plain white" style.
Color
The accent color of the widget. In the "Fully colored" style, the color fills the widget header. In the "Partially colored" style, the color applies to the top border and the widget title. In the "Plain white" style, the color applies to the widget title. Available for all styles except "Glass effect."
Hide border
Select the checkbox to display the widget without a border.
Object
The object whose data the pivot table displays. For example, to analyze opportunities, select "Opportunity."
As a result, the Fields block displays the columns of the selected object in the Field name list.
2. Set up rows, columns, and values
Add at least one value to display data in the pivot table.
-
Add a column to the Rows, Columns, or Values block. To do this, click
 next to the column in the Field name list and select Add to rows, Add to columns, or Add to values.
You can also drag the column from the Field name list to the needed block. To add a column of a related object, click
 next to the block and select the column on the Related objects tab of the window that opens.
For example, add the "Account" column to the Columns block, the "Created on" column to the Rows block, and the "Budget" column to the Values block.
-
Set up the added items if needed. To do this, click
 next to the item and fill out the Field settings window.
Field name
Field value
Title
The item title displayed in the pivot table. Available for all items.
Group by
The period by which to group the values of a "Date/time" type column. Available for "Date/time" type columns in the Rows and Columns blocks. Available values: "Full date," "Year," "Year and month," "Month," "Week," "Day, month and year," "Day and month," "Day," "Hour." Out of the box, Creatio uses "Year and month." For example, to group opportunities by month of each year, keep "Year and month" for the "Created on" column.
How to calculate totals
The aggregate function used to calculate values. Available for items in the Values block. Available values: "Count," "Distinct count," "Sum," "Minimum," "Maximum," "Average," "Median." Out of the box, Creatio uses "Count." For example, to calculate the total opportunity budget, select "Sum" for the "Budget" column.
-
Save the changes in the Field settings window.
To remove an item from a block, click  next to it.
As a result, the canvas displays the pivot table structure with empty values and updates as you change the setup.
3. Add a calculated field
A calculated field contains a value that Creatio calculates using a formula based on numeric columns of the object. You can use a calculated field in rows, columns, and values the same way as other columns.
-
Click Add calculated field in the Fields block.
-
Enter the field title in the Title field.
-
Build the formula. To do this, select columns in the Select field menu and use the toolbar buttons to add arithmetic operators and parentheses. You can also type numbers and operators directly.
For example, to calculate the weighted opportunity budget, build the following formula:
"Budget" * "Probability, %" / 100. -
Click Validate to check the formula.
-
Click Save.
As a result, the calculated field appears in the Field name list. To change the formula or delete the field, click next to the field and select Edit formula or Delete.
4. Filter the pivot table data
Filter the records that the pivot table displays. A static filter applies the same conditions to the pivot table data in any context. A filter by page data connects the pivot table to the data of the page, for example, to display data of connected records.
Filters also help you stay within the data limit. The "Request limit for pivot table data" (PivotTableRequestDataLimit code) system setting sets the maximum number of records that a pivot table loads. Out of the box, the setting value is "-1," and Creatio loads all records. If the number of records exceeds the limit, Creatio stops loading data and displays an icon in the top-left corner of the pivot table. Click the icon to view the limit. To display all needed data, add filters that reduce the number of records or ask your system administrator to increase the limit. Learn more: Description of system settings.
- Go to the Data block of the setup area.
- Set up a static filter if needed. To do this, click Set up filter and add filter conditions in the window that opens.
- Set up a filter by page data if needed. To do this, click next to the Apply filter by page data parameter → select the data source in the Data source field → match the page data to the column of the pivot table object.
As a result, the pivot table displays only the records that match the filter conditions.
5. Save the page
Save the changes in Freedom UI Designer.
As a result, the "Sales" homepage displays the pivot table with record data.