Sales forecast configuration
A reliable forecast rarely comes from a single number. Sales reps know their deals best, managers adjust the numbers with their own judgment, and leadership needs the totals for the whole team. When each level works in its own spreadsheet, the numbers drift apart and nobody knows which number is final.
A forecast in the Sales forecasts section brings these levels together in one table. Reps submit their forecast calls, managers see the deals behind each number, and the totals roll up the sales hierarchy automatically. You decide what the table shows: which people or groups form the rows, which periods form the columns, and which metrics Creatio calculates for each of them.
Creatio stores these decisions in the forecast configuration. This article explains each part of the configuration, what it is for, and how it affects the numbers users see. Learn more about the setup: Set up sales forecasts.
Forecast hierarchy
The forecast hierarchy defines the rows of the forecast table and how numbers roll up. Each node is a row, and every parent node shows the totals of its child nodes. This enables a sales rep to see their own numbers, a manager to see the team, and a sales director to see the entire organization in the same table.
A typical sales hierarchy follows the reporting structure: the head of sales at the top, managers below, and sales reps under each manager. However, you can build the hierarchy on any object. For example, build it on accounts to forecast by key customer, or on product categories to forecast by product line.
Creatio builds the hierarchy from a hierarchy source, which is the object whose records become nodes, and a hierarchy relation field, which links each record to its parent. For contacts, this field is usually Manager. Creatio can build the tree automatically from the relation field, and you can narrow the records with a filter, for example, to include only employees. You can also build the tree manually or adjust an automatically built tree to match how your team actually works.
Choose the hierarchy source carefully. Creatio locks the source after you save the hierarchy, and locks the hierarchy of a forecast after you save the forecast.
Forecast period and cadence
The period type defines the columns of the forecast table: months, quarters, or years. Pick the period that matches how your company plans and reports revenue, for example, quarters for a company that sets quarterly targets.
The forecasting cadence defines how often sales reps submit their forecast. With submission status turned on, the table shows an icon next to each row: green if the person submitted a forecast in the current cycle, orange if the latest forecast is from a previous cycle and needs an update, and red if the person has not submitted a forecast yet. Managers see at a glance who still owes a number, without chasing reps by email.
Forecast columns
Columns are the metrics the table shows for each row and period. They are the most flexible part of the configuration. You can change any preconfigured column and add your own, so the table reflects the metrics on which your sales process relies.
Each column has a type that defines from where its value comes.
Editable
Users enter the value manually. Use this type for targets and other numbers that come from planning rather than from records, for example, a quota or a stretch target.
For parent nodes, the Parent aggregation setting defines how the value behaves. With "Editable," a manager enters a team value separately, for example, a team quota that differs from the sum of individual quotas. With "Aggregation," Creatio calculates the parent value from its child nodes.
Value from object
Creatio calculates the value from records of any object, for example, opportunities, orders, or invoices. This column type turns the forecast table into a live view of your data, and it lets you model many business cases without custom development.
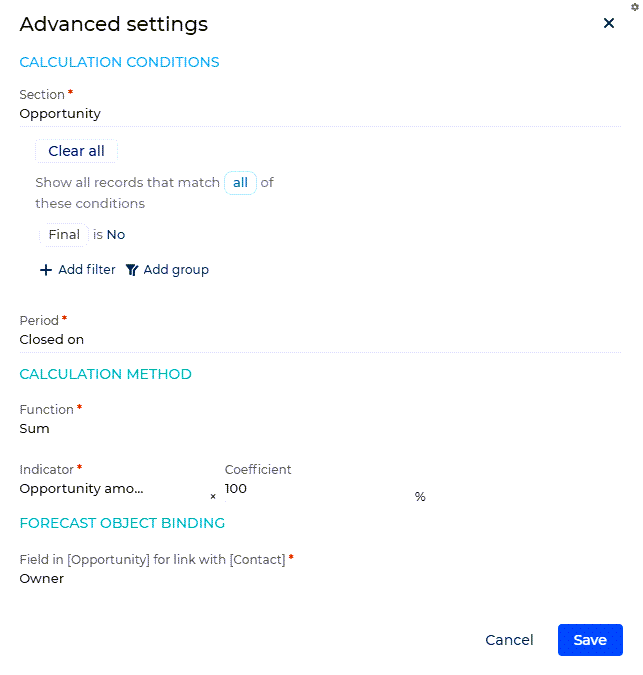
Set up the calculation in the Advanced settings window of the column whose type is "Value from object." To open it, open the forecast in the Sales forecasts configuration section → Layout tab → click the column name → Advanced settings. The window settings answer the following questions:
- Which records count. The Section field defines the object whose records Creatio uses. Filter conditions below it narrow the records down, for example, to opportunities in the "Closed won" forecast category. When you change the section, Creatio clears the other settings of the window, so select the section first.
- To which period the records belong. The Period field defines the date field that places each record in a period column, for example, Closed on for opportunities.
- How to calculate the value. The Function field defines the calculation: "Count," "Sum," or "Average." The Indicator field defines the field to calculate, for example, the opportunity amount. The Coefficient field applies a percentage to the result, for example, 50% for a weighted pipeline.
- To which row the records belong. The Field in [Opportunity] for link with [Contact] field defines how each record is linked to a hierarchy node. The object names in the field label change with the selected section and hierarchy source. For example, the opportunity owner for a hierarchy of sales reps.
For example, the preconfigured Open pipeline column takes opportunities whose stage is not final, places them in periods by the Closed on date, and sums their amount with a 100% coefficient.
For example, here is what you can model this way:
- Booked revenue. The sum of the amount of opportunities in the "Closed won" category, by close date.
- Committed pipeline. The same calculation for opportunities in the "Commit" category.
- Weighted pipeline. The amount of "Best case" opportunities with a coefficient, for example, 50%, to reflect that not all of them close.
- Manager judgement. The amount of opportunities that the manager includes in the forecast through the In/out Forecast field, regardless of their category.
- Number of committed deals. The count of opportunities in the "Commit" category, to track how many deals each rep intends to close.
- Average deal size. The average amount of opportunities in the "Closed won" category, to compare deal size across the team.
Formula
Creatio calculates the value from other columns of the forecast. Use this type for KPIs that compare metrics, for example, the gap between quota and booked revenue, or pipeline coverage that shows open pipeline as a percentage of the quota.
Forecast call
The official number that a sales rep or manager submits for a period. Unlike "Value from object" and "Formula" columns, which Creatio calculates, a forecast call reflects the person's commitment. Creatio keeps the history of submissions, so leadership can compare what the team committed to with what it actually closed.
A forecast call often starts from a number that Creatio already calculates, for example, the committed amount. The Reference column for submissions field of the "Forecast call" column keeps submissions consistent with data. When a user submits a forecast call, Creatio prefills the value from this column, so reps start from current data instead of copying numbers by hand. If the field is empty, users enter the value manually. Learn more: Set up sales forecasts.
You can also lock the prefilled value for specific users or roles. For example, sales reps submit exactly their committed amount, while managers can adjust the number based on their judgment. Learn more: Access to forecast data.
Additional column settings
Each column also has display settings in the Column configuration window. Slider visibility shows progress toward a target column, for example, booked revenue against quota. Hide decimal numbers shows values as whole numbers. Column text color and Column background color help highlight key metrics, for example, a gap that still has to be closed.
Default forecast configuration
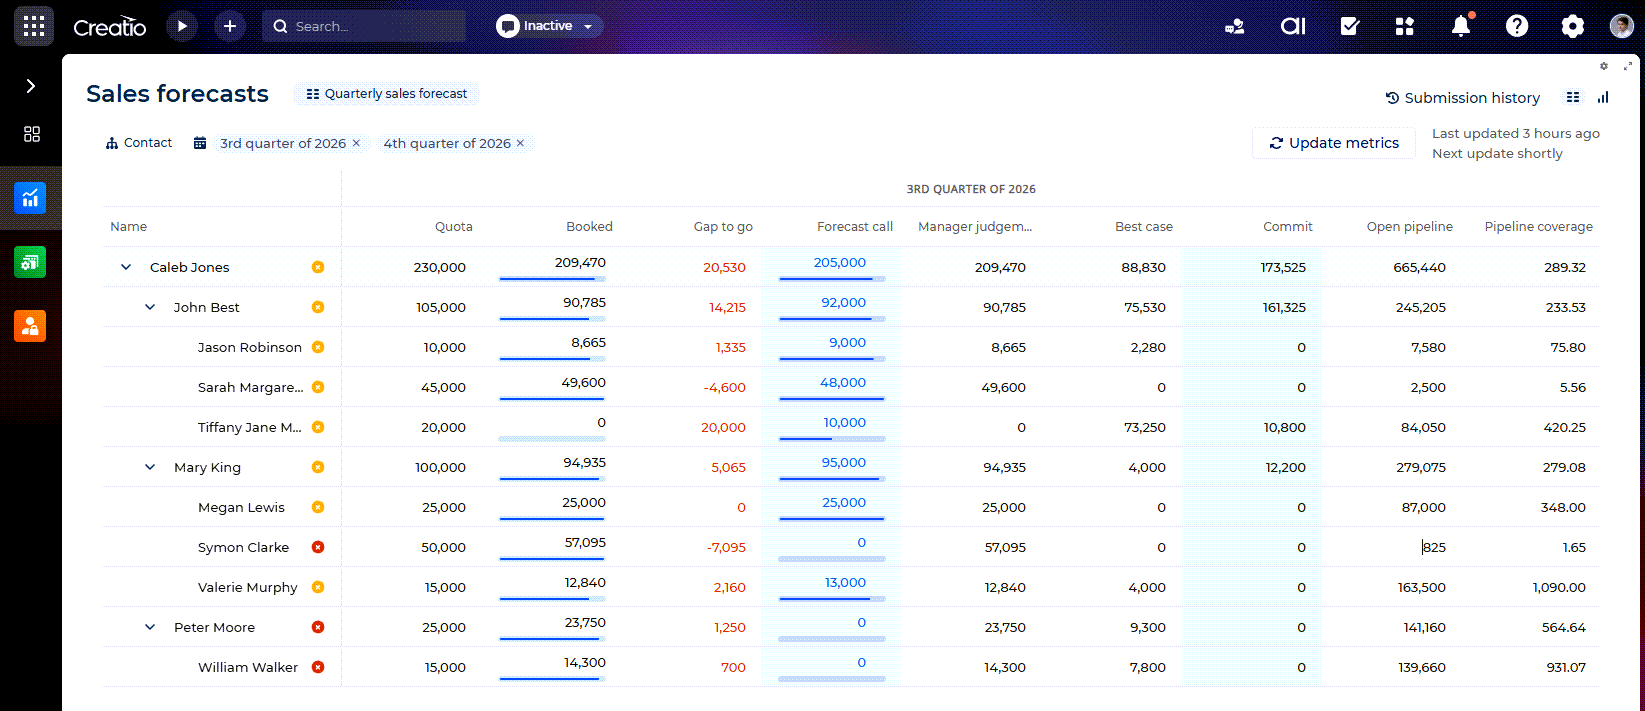
The app includes a preconfigured "Quarterly sales forecast" forecast. It uses quarters as the period type and comes with columns that cover a typical sales forecasting process. When you create a new forecast, add its columns yourself.
Column | Type | What it shows |
|---|---|---|
Quota | Editable | The sales target for the period. |
Booked | Value from object | The amount of opportunities in the "Closed won" category. |
Gap to go | Formula | The amount still needed to reach the quota. |
Forecast call | Forecast call | The number submitted by the person for the period. |
Manager judgement | Value from object | The amount of opportunities the manager includes in the forecast. |
Best case | Value from object | The amount of opportunities in the "Best case" category. |
Commit | Value from object | The amount of opportunities in the "Commit" category. |
Open pipeline | Value from object | The amount of opportunities whose stage is not final. |
Pipeline coverage | Formula | Open pipeline as a percentage of the quota. |
"Value from object" type columns calculate values from forecast categories that Creatio assigns to opportunities based on their stage. Learn more: Revenue intelligence overview.
Metric updates
Creatio can keep forecast metrics up to date in the following ways that work independently:
- Live update. Creatio updates the metrics as forecast data changes. Users see edited values, record changes, and recalculated formulas right away. This option works best for smaller data volume.
- Scheduled updates. Creatio regularly runs a cron job that recalculates all forecast data. This option is recommended for large data volume.
Changes to the configuration itself, such as the hierarchy, columns, or period type, take effect on the next scheduled update or when a user clicks Update metrics. The Sales forecasts section shows when Creatio last updated the metrics and when the next scheduled update runs, so users know how current the numbers are.
Opportunity panel
When users review a forecast, they often need the details of one opportunity, for example, its stage, owner, or recent activity. The opportunity panel shows these details next to the forecast table, so users stay in the forecast while they review the opportunity. Users open the panel by clicking the opportunity name in the list of opportunities below the table. Learn more: Work with sales forecasts.
The panel is a Freedom UI page. Its Summary, Activity, and Timeline tabs cover the typical needs of a pipeline review, and you can change them to match your sales process, for example, add a field that your team checks during every review. To open the page in the Freedom UI Designer, click  in the top right.
Access to forecast data
Forecast data is often sensitive, so access follows the hierarchy. For each node, define the following permissions:
- Forecast visibility. Who can view forecast data within the node.
- Quota management. Who can edit quota values at the node. Everyone else sees quotas as read-only.
- Forecast submission. Who can submit forecast calls on behalf of the node. If the "Forecast call" column has a reference column for submissions, you can make the value read-only for a user or role. These users can still submit, but the value always matches the reference column.
For example, a sales rep can view and submit only their own forecast, while a manager can view the whole team and set quotas for it. System administrators can view and edit all forecast data.