Bulk email analytics
The Bulk email analytics dashboard aggregates delivery, engagement, and unsubscribe metrics across every bulk email in the section. To open the dashboard, go to the Bulk emails section of the Email Marketing app and click  on the section toolbar. Learn more: View analytics.
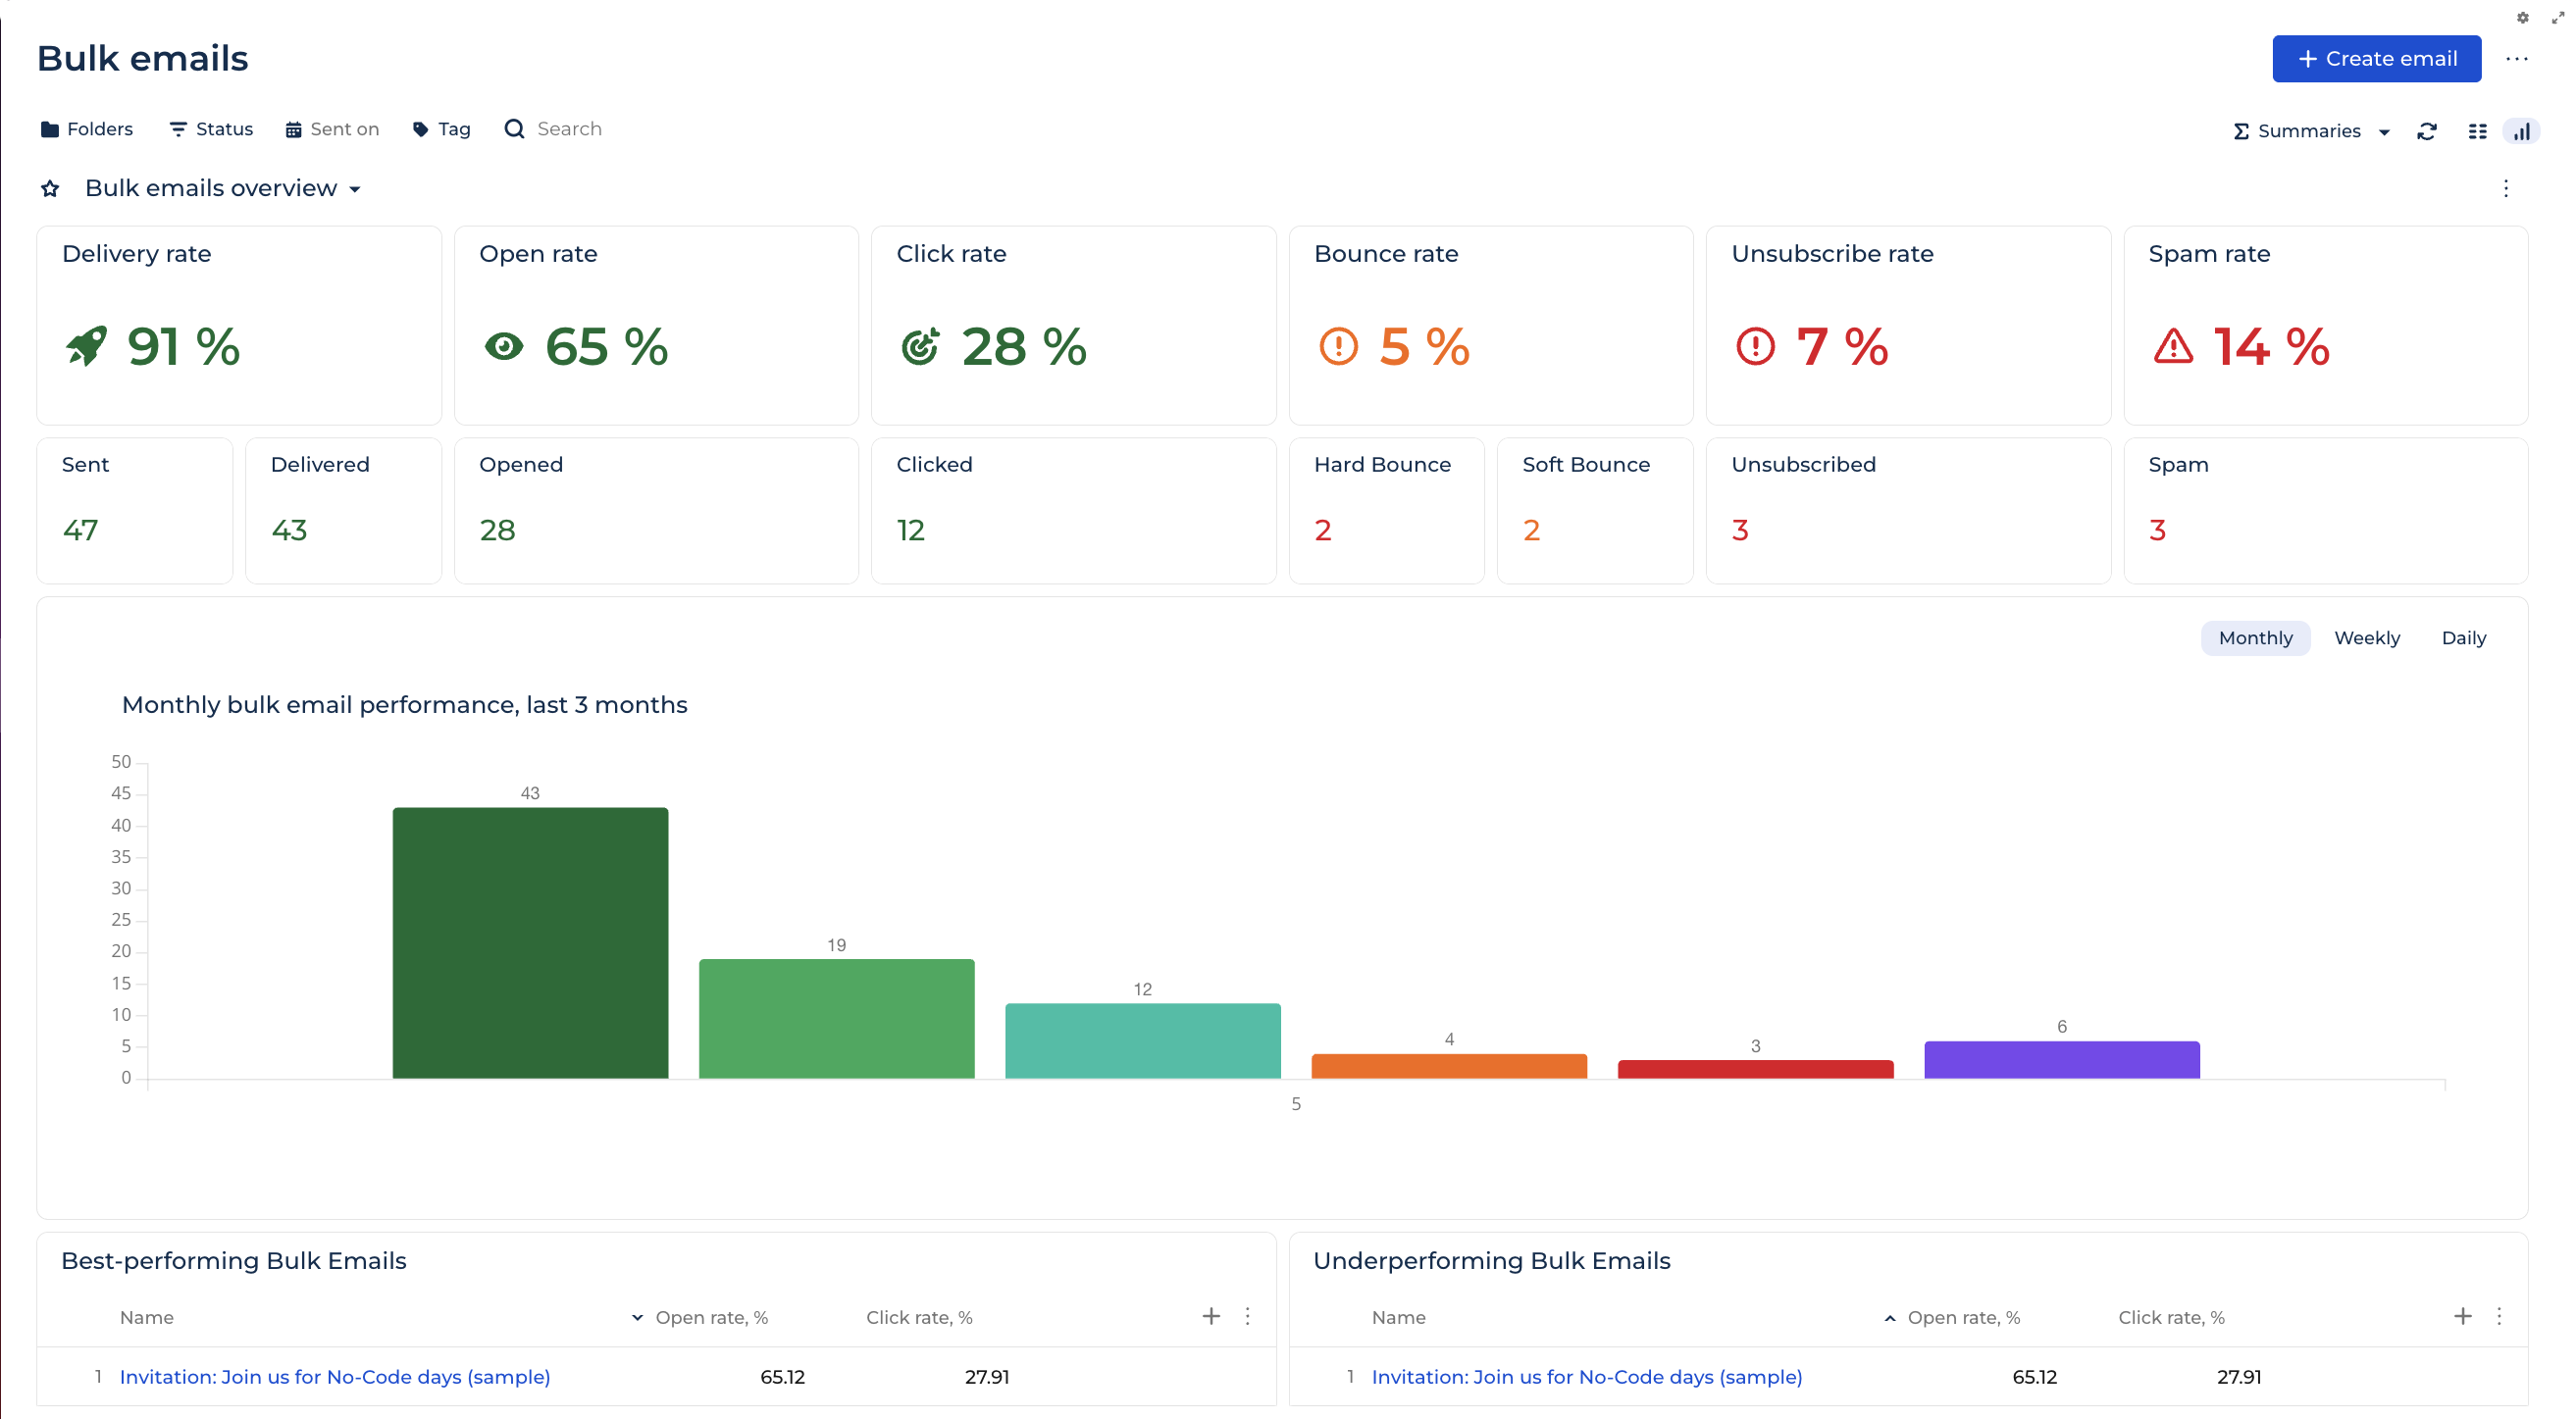
Performance rates
Each widget shows a percentage derived from response data.
Widget | Description | Calculation |
Delivery rate | Percentage of bulk emails delivered out of total sent. | Delivered / Sent * 100. |
Open rate | Percentage of unique recipients who opened the delivered emails. | Unique opens / Delivered * 100. |
Click rate | Percentage of unique recipients who clicked any link in the delivered emails. | Unique clicks / Delivered * 100. |
Bounce rate | Combined percentage of hard and soft bounces out of total sent. | (Hard Bounce + Soft Bounce) / Sent * 100. |
Unsubscribe rate | Percentage of recipients who unsubscribed after receiving a delivered email. | Unsubscribed / Delivered * 100. |
Spam rate | Percentage of recipients who marked the delivered emails as spam. | Spam complaints / Delivered * 100. |
Engagement counts
Creatio aggregates response data from every bulk email in the section to calculate these counts. Learn more: Personal responses.
Widget | Description |
Sent | The total number of bulk emails forwarded to the cloud email service. |
Delivered | The total number of bulk emails accepted by the recipient's mail server. Corresponds to the "Delivered" response on the Audience tab of the email page. |
Opened | The total number of unique opens. Multiple opens of the same email by the same recipient count once. |
Clicked | The total number of unique clicks. Multiple clicks of the same email by the same recipient count once. |
Hard Bounce | The number of emails returned with a permanent delivery failure, for example, an invalid email address or a non-existent domain. |
Soft Bounce | The number of emails returned with a temporary delivery failure, for example, a full mailbox or a temporarily unavailable mail server. |
Unsubscribed | The total number of recipients who unsubscribed after receiving a delivered email. |
Spam | The total number of recipients who marked a delivered email as spam. |
Bulk email performance
Plots the count of each metric over the selected period. Switch between Monthly, Weekly, and Daily with the toggle above the chart.
Best-performing bulk emails
Ranks the top 10 bulk emails by open and click rate. Click a value in the Name column to open the bulk email page.
Column | Description |
Name | The bulk email name. |
Open rate, % | Percentage of unique recipients who opened the delivered email. |
Click rate, % | Percentage of unique recipients who clicked any link in the delivered email. |
Underperforming bulk emails
Ranks the bottom 10 bulk emails by open and click rate. Uses the same columns as the Best-performing bulk emails widget.
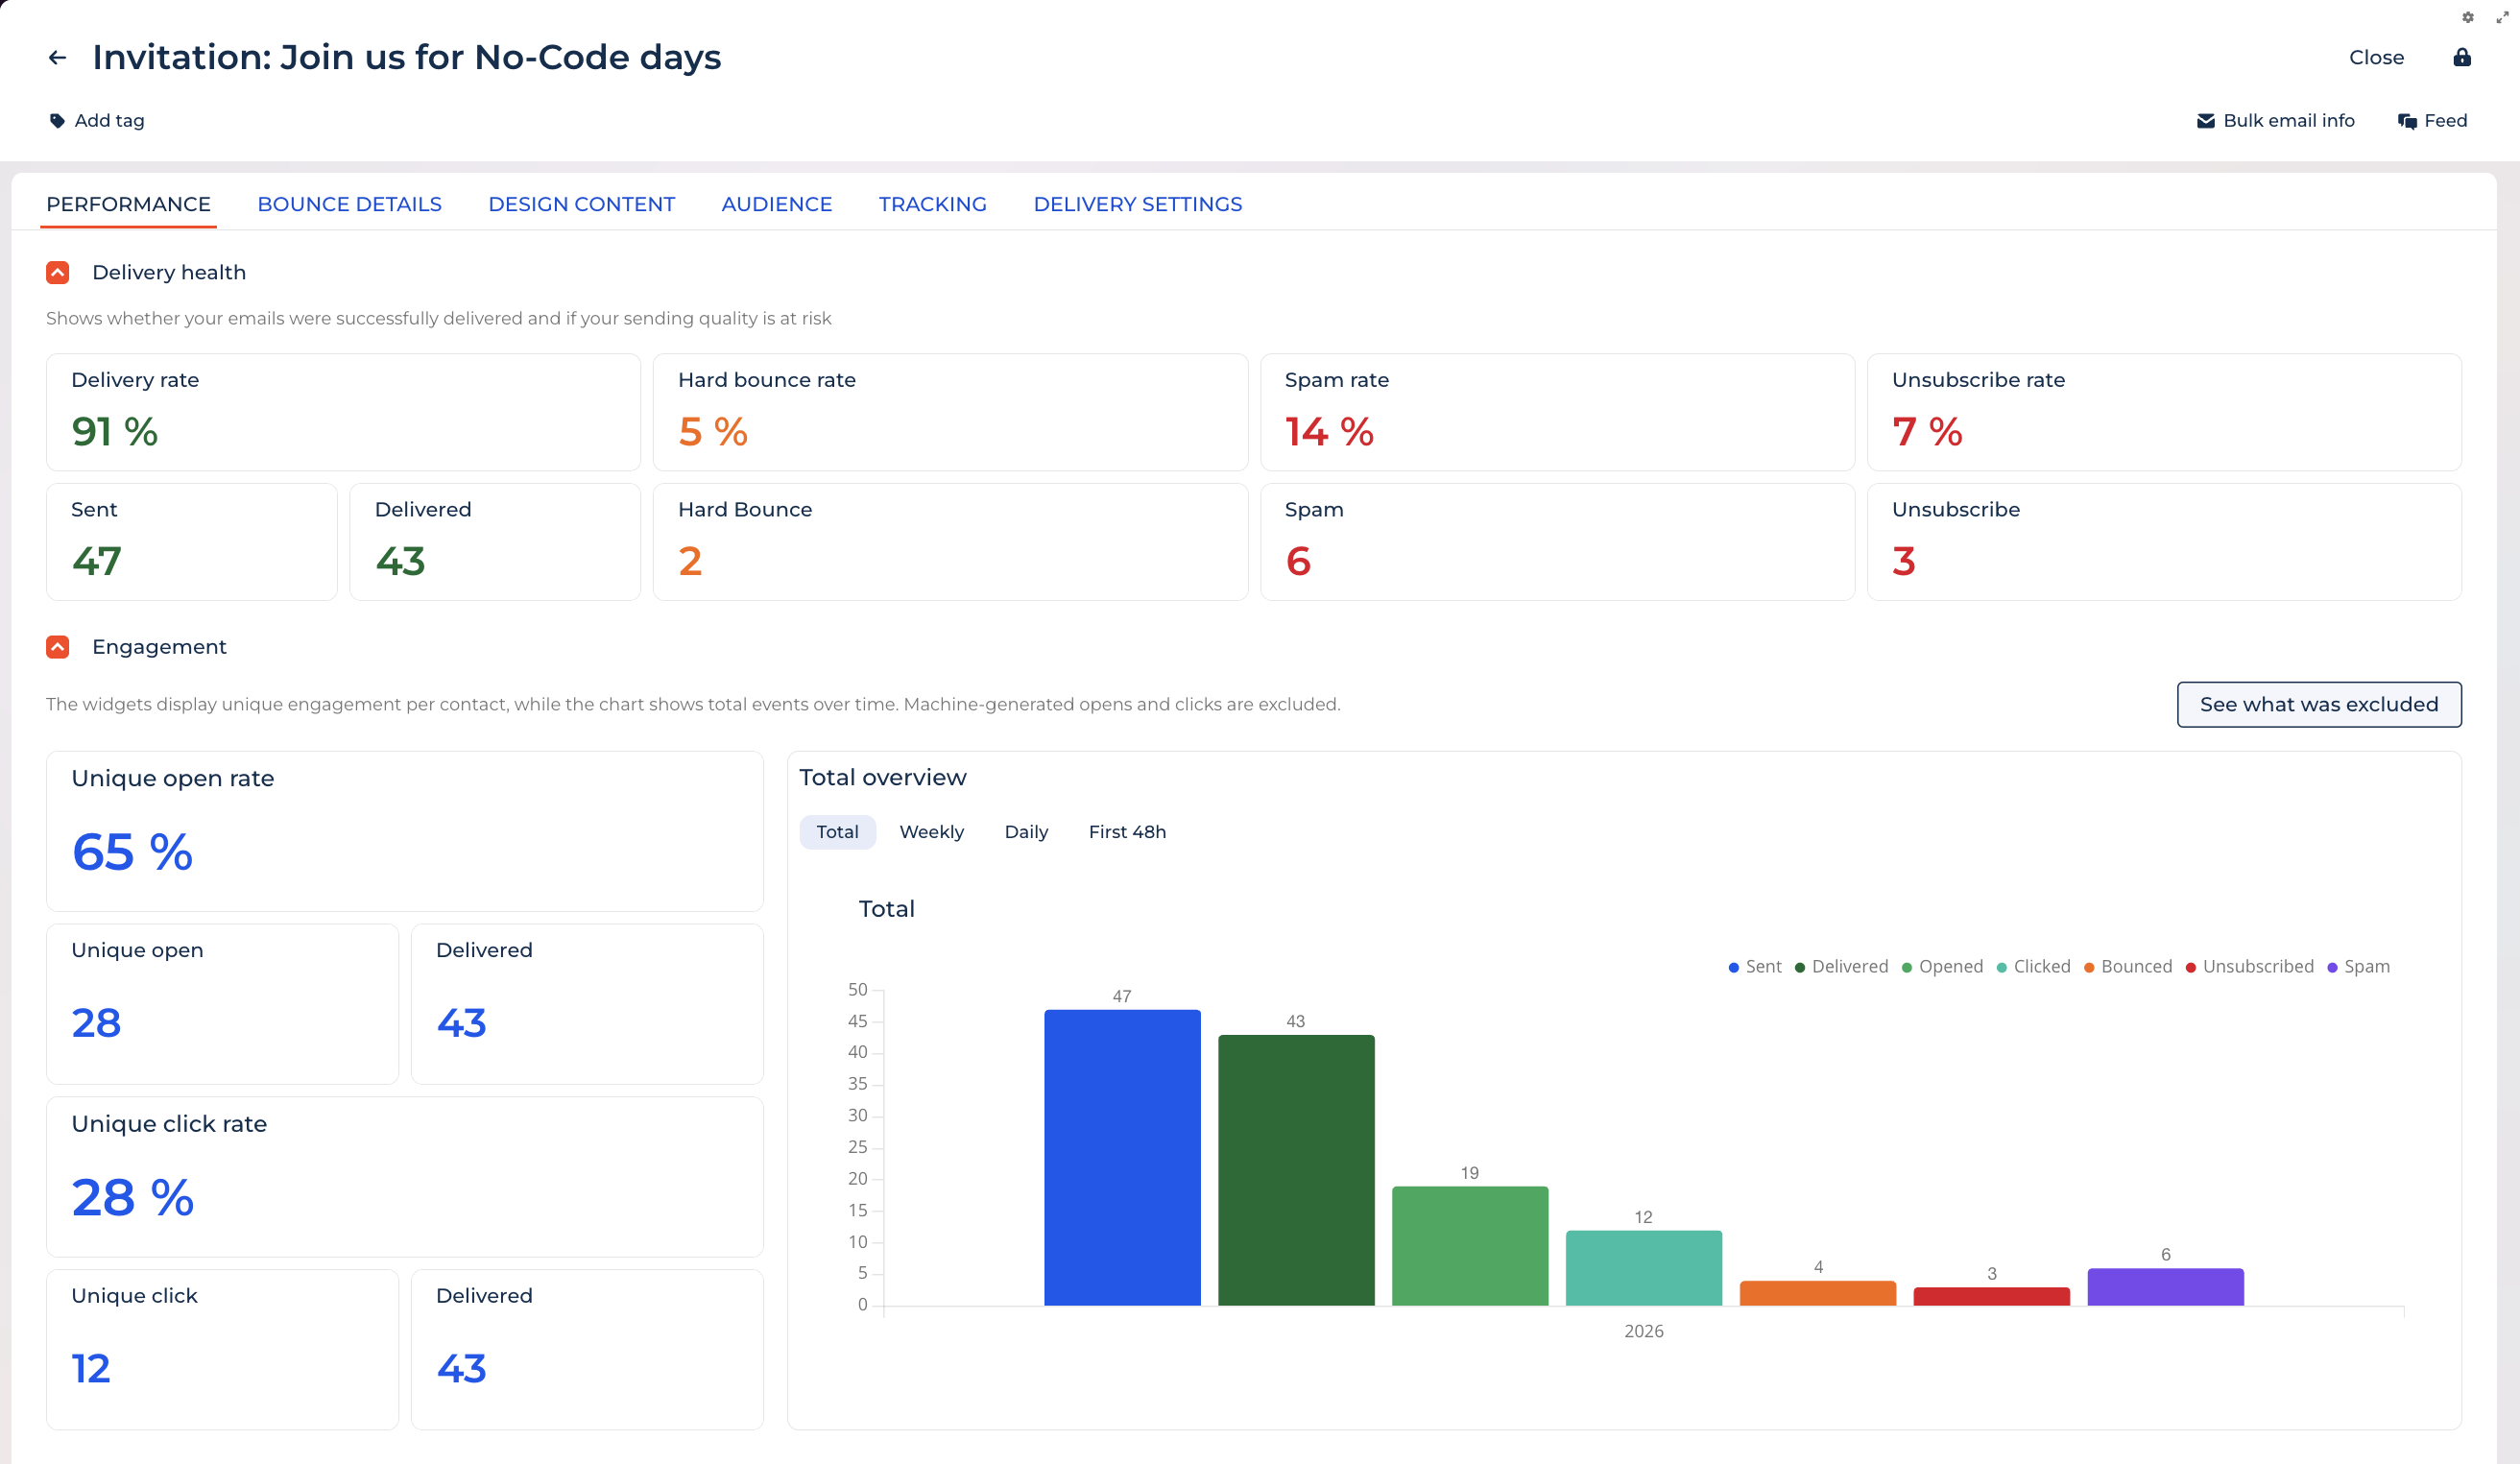
Performance tab
Each bulk email also has a Performance tab that breaks down Delivery health and Engagement for that single email. To open it, click a bulk email name, then open the Performance tab. Learn more: Email progress.