Sales pipeline
Sales pipeline helps you analyze the deals to detect the bottlenecks in the sales department operation in time and react accordingly. You can estimate the conversion rate between stages, pipeline completeness, and compare pipelines of individual associates or sales teams.
Set up the sales pipeline
The pipeline displays the following stages out of the box:
-
Qualification.
-
Presentation.
-
Proposal.
-
Contracting.
-
Closed won.
Creatio hides the "Closed lost" stage from the sales pipeline out of the box.
You can include certain stages in or exclude them from your pipeline. Set up the way to display the stages in the "Opportunity stages" lookup. The Number field in the "Opportunity stages" lookup determines the stage order. Learn more: Set up opportunity stages.
To set up the display of opportunity stages in the pipeline:
-
Click
 to open the System Designer.
 -
Go to the "System setup" block → "Lookups."
-
Open the "Opportunities" folder → "Opportunity stages" lookup.
-
Set the Show in funnel column to "Yes" to display the opportunity stage in the sales pipeline or set the column to "No" to exclude the stage from the pipeline.
-
Save the changes.
View the sales pipeline
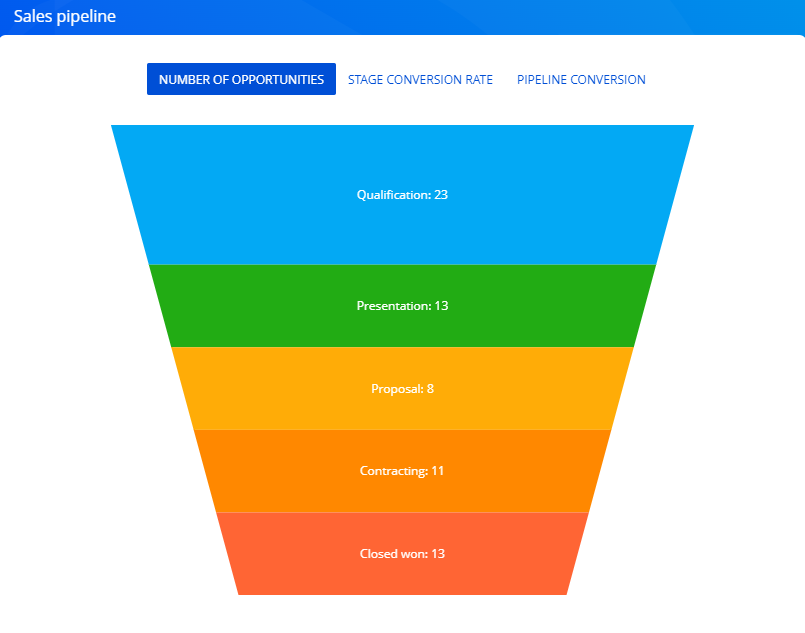
View the sales pipeline on the Sales and Lead and Opportunity homepages. The height of pipeline slices is congruent to the number of opportunities that currently have the corresponding status. Opportunities that have "Closed lost," "Closed rejected," and "Closed rerouted" statuses are not taken into account.
You can analyze the pipeline by multiple indicators:
-
Number of opportunities. Displays the distribution of opportunities by stages. For example, the "Qualification" slice displays the number of opportunities that have the "Qualification" stage.
-
Stage conversion rate. Displays the percentage of opportunities that moved from one stage to another. The chart displays all opportunities that have records on the Stage history expanded list. The conversion rate is calculated as the ratio of the current stage to the previous stage. For example, the number of opportunities that have the "Presentation" stage is 10. The number of opportunities that have the "Proposal" stage is 4. The stage conversion rate is calculated as the ratio of the "Proposal" stage to the "Presentation" stage multiplied by 100%. In this example, the "Proposal" stage conversion rate is 40%.
-
Pipeline conversion. Displays the percentage of opportunities on the stage relative to the "Qualification" stage. The opportunity percentage on the "Qualification" stage is always at 100%. For example, you have 10 opportunities that have the "Qualification" stage. The "Presentation" stage has 5 opportunities. The stage conversion rate of the "Presentation" stage is calculated as the ratio of the "Presentation" stage to the "Qualification" stage multiplied by 100%. In this example, the "Presentation" stage conversion rate is 50%.