Information about the email progress is available on the Email totals and Audience tabs, as well as on the email progress diagram. The tab displays percentage and volumes of email deliveries, recipient responses, as well as “open” and “click” statistics.
Diagrams on sending and delivery errors
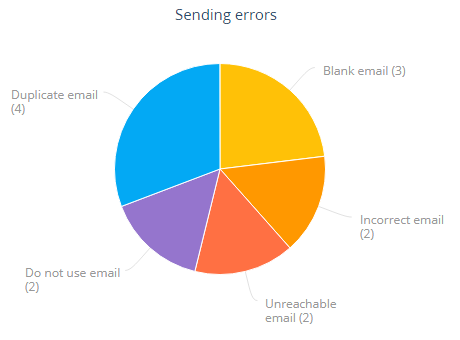
Sending error chart
The sending error chart (Fig. 1) displays the total number of undelivered emails (those that have not been sent by Creatio) grouped by sending errors. The diagram uses information from the Audience detail and shows records with the following responses: “Canceled (unsubscribed from all emails),” “Canceled (invalid email),” “Canceled (incorrect email),” “Canceled (email not provided),” and “Canceled (Duplicate email).”
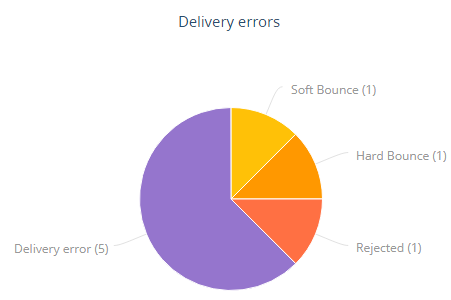
Delivery error chart
The delivery error chart (Fig. 2) displays the total number of undelivered emails (those that have been sent by Creatio, but have not been delivered) grouped by delivery errors. The diagram uses the information from the Audience detail and shows records with the following responses: “Soft Bounce,” “Hard Bounce,” “Rejected,” “Delivery error.”
Possible reasons of delivery errors
Several factors may cause undelivered email:
-
emails may be blocked by spam filters of email providers
-
the low reputation of your email account on an email provider server
-
email sending quota set by email providers
-
outdated list of emails
The high “Hard bounce” rate indicates that your email recipient list contains many invalid email addresses. The “Soft bounce” response indicates temporary problems, such as “mailbox full.” If a large number of recipients unsubscribe from your emails, this may indicate that your recipient list is outdated. The “Denied” response may also mean that an email was not delivered due to technical reasons. Read more: Personal responses.
Delivery statistics
The delivery statistics diagram (Fig. 3) displays metrics for unique email responses. The data is updated every 5 minutes.
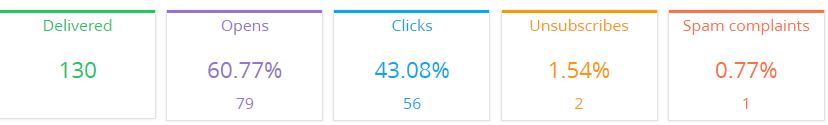
The data on the delivery statistics diagram and the Email totals may differ from the data on the Audience tab. This is because Creatio receives aggregated and individual responses at a different rate.
The data is displayed on separate “metric” dashboard components. Each indicator can have either a percentage or a quantitative value. The percentages are displayed to the total number of delivered emails (the Delivered metric).
|
Delivered |
The number of delivered emails. Indicates the total number of recipients, whose mail provider response is “Accepted by the server.” You can display this metric in the list using the Delivered column. |
|
Opens |
The number and percentage of times emails were opened. The indicators are calculated based on opens by unique recipients. For example, if a recipient opens an email several times, the indicators will show only one “open.” These indicators account for cases when no information about opening the email was received from the recipient, but information about clicked links, unsubscription or flagging the email as spam exists. The metric can be displayed in the list using the No. of opens and Opens, % columns. |
|
Clicks |
The number of emails where recipients followed links in the message text and its percentage to the number of delivered emails. The indicators are calculated based on clicks by unique recipients. For example, if a recipient follows same link in the same email several times, this will still count as a single click. Clicking the “unsubscribe” link does not count as a “click” in this metric. The metric can be displayed in the list using the Number of clicks and Clicks, % columns. |
|
Unsubscribes |
The number and percentage of unsubscribed recipients. The metric can be displayed in the list using the No. of unsubscribes and Unsubscribe rate, % columns. |
|
Spam |
The number and percentage of times the emails were sent to spam. Only manual spam flagging will be calculated. The metric can be displayed in the list using the No. of spam complaints and Spam rate, % columns. |
You can also view the number of sent emails. To do this, display the Sent count column in the list.