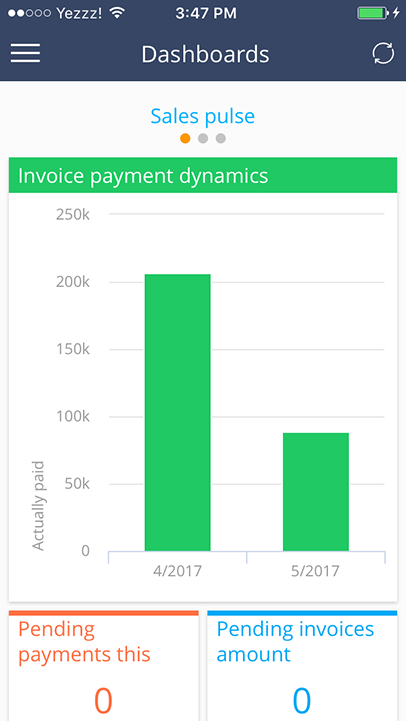
The Dashboards section of the mobile application is used to display collective data from the Dashboards section of the primary Creatio application. (Fig. 1). The data displayed in the section is based on access rights.
We recommend using this section to analyze and plan the work of each employee, each department, and the company as a whole.
The section data is cached in the mobile application. Press the  button to refresh the section. Cached data is cleared when you exit the section or close the mobile application.
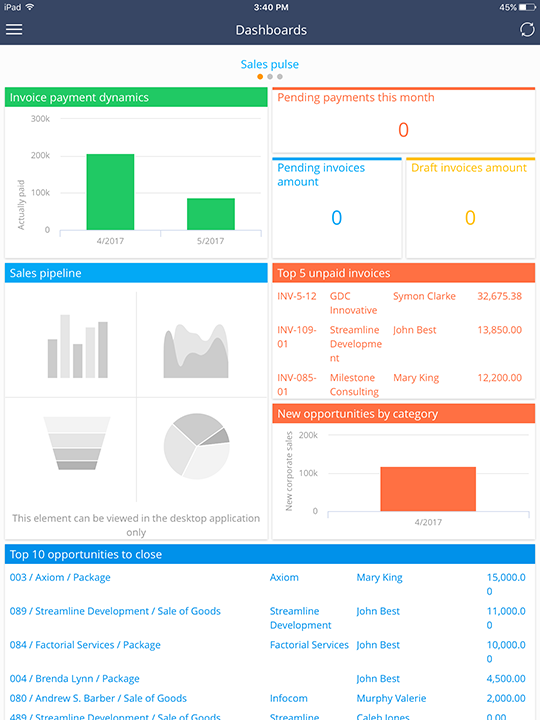
Each Dashboards section tab of the main Creatio application is displayed on its respective screen in the mobile app. The tablet version of the mobile application features the dashboards view similar to that of the desktop version. All graphs are scaled to fit different screen sizes. The element size is doubled in the smartphone version of the mobile application. Indicators that occupy less than 50% of the screen in the main application will occupy 50% of the screen of the smartphone.
Swipe left and right to switch between different tabs/dashboards or use the list of dashboards for navigation.
The following dashboard types of the primary Creatio application are available in the mobile version: “Chart”, “Metric”, “List” and “Gauge”. Additionally, mobile dashboards support graphs with multiple series and all sub-types of the “Chart” dashboard. Unsupported dashboard types are hidden in the smartphone version of the mobile application and greyed out in the tablet version (Fig. 2).
Click on a graphic element (e.g. a column) to display a data label. Use the scrollbar to view larger charts (select the element to activate the scrollbar).