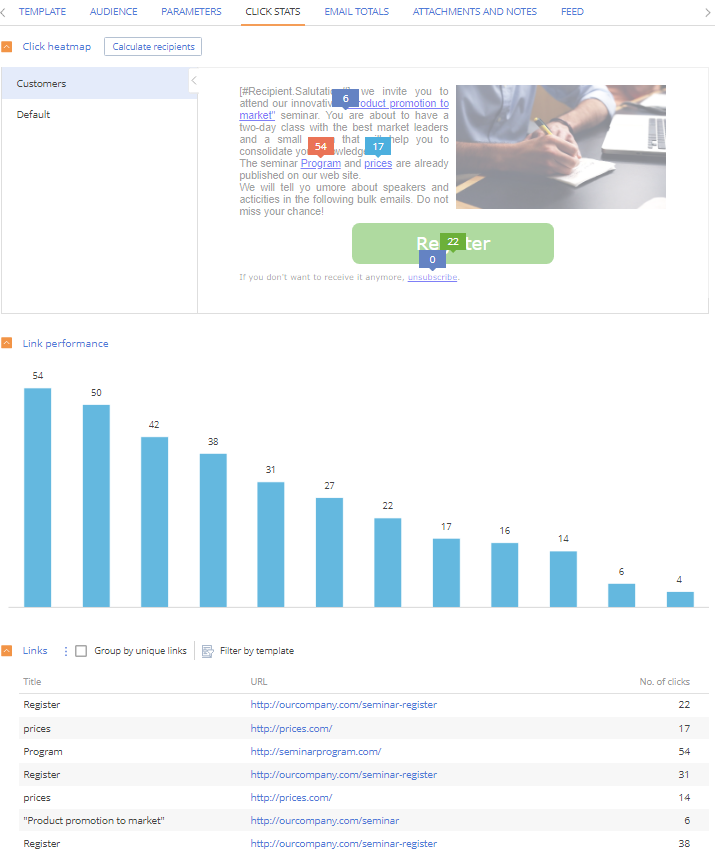
Use the Click stats tab of the email page to access a detailed performance statistics on every link in your emails (Fig. 1).
The Click stats tab contains:
-
-
Click heatmap. It enables you to analyze your subscribers’ interests and improve the email layout. The click heatmap is updated every two hours.
-
-
-
Link performance chart. Use it to analyze how popular the email links are.
-
-
-
Links. Displays the number of clicks by specified links.
-
Note that the number of clicks you see on the Click stats tab might differ from the delivery statistics on the Email totals tab:
-
-
The Clicks metrics on the Email totals tab displays the total number of unique contacts who received a “Clicked” response during the email sending process. For example, if a recipient clicks multiple links in one email, they will be recorded as a single click.
-
-
-
The Click stats tab displays click numbers for all individual links in the email, i.e. each click is taken into account during calculations. For example, if the recipient clicked two or more links, all clicks will be taken into account.
-
Displaying of dashboards on the Click stats tab depends on the email content type: dynamic or static. For emails with dynamic content the number of links depends on the URLs used in all template replicas. The click statistics treats each URL in each replica as a unique link, regardless of whether it is in the dynamic or static content block. Creatio adds a unique parameter to all URLs in a template. This parameter is used for differentiating links from different replicas by Creatio. Click stats are calculated separately for each replica. More information on the topic is available in the “Configure dynamic content for emails” article.
Analyze the heatmap
Click heatmap is a tool to measure and display statistics by clicks. The click heatmap shows clicks directly on the email template. Each clicked link shows the number of clicks next to it (Fig. 1). The color of the click prompt illustrates how popular the link is: the minimum number of clicks in the email is marked in blue, while the maximum number is marked in red.
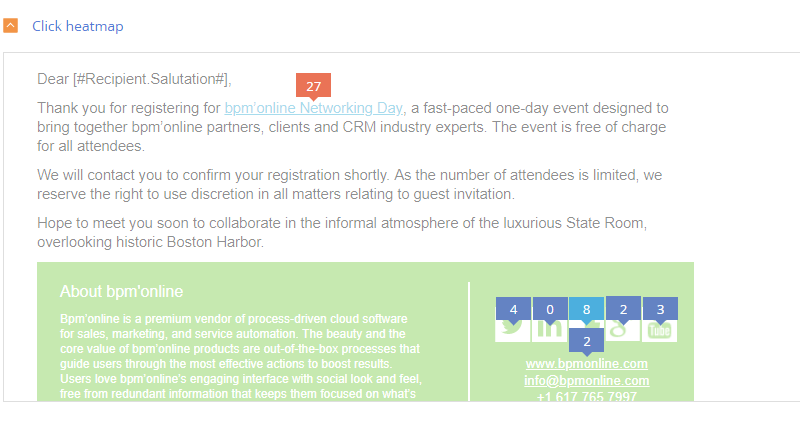
A “click” on the heatmap represents a unique contact from the email audience, who followed a link in the email. If the same recipient clicked the same link several times, the heatmap will still display this as a single click.
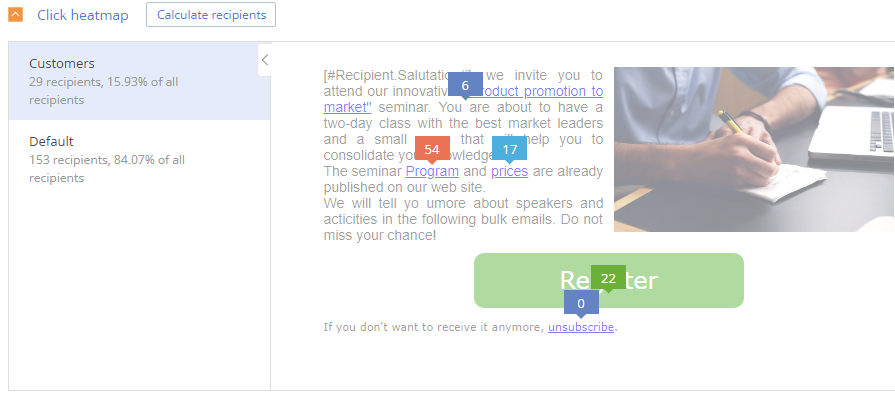
For emails with dynamic content, the heatmap is available for each of the different replicas (Fig. 2). To see the click stats for a replica, select it in the list to the left of the heatmap. Creatio calculates click statistics separately for every replica.
You can use the Calculate recipients button for this purpose. When you click the button for each replica, Creatio calculates the number of contacts such replica has been sent to, as well as the percentage of the replica recipients from the total email audience. The calculation results are displayed under the replica titles.
Analyze the opens/clicks chart
The link performance bar chart (Fig. 1) displays the number of unique clicks per link.
Use it to analyze how popular the email links are. You can edit link titles that are displayed on the chart using the Links detail.
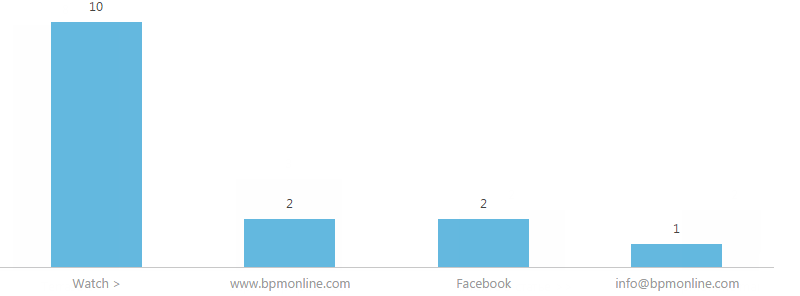
If you use more than 7 unique links in your email, their titles will not be displayed in the chart. To view the detailed information on each of the links, hover the cursor over the corresponding bar on the chart (Fig. 2).
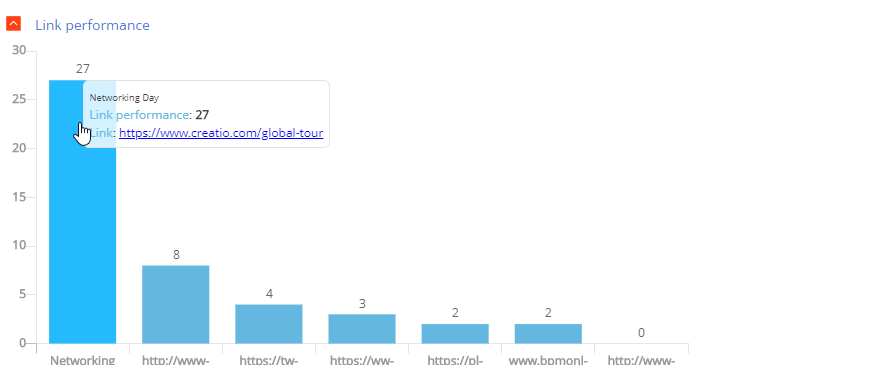
For emails with dynamic content, the chart shows the number of clicks per link for every template replica.
Analyze clicks
The number of clicks for each link is available on the Links detail of the email page (Fig. 1).
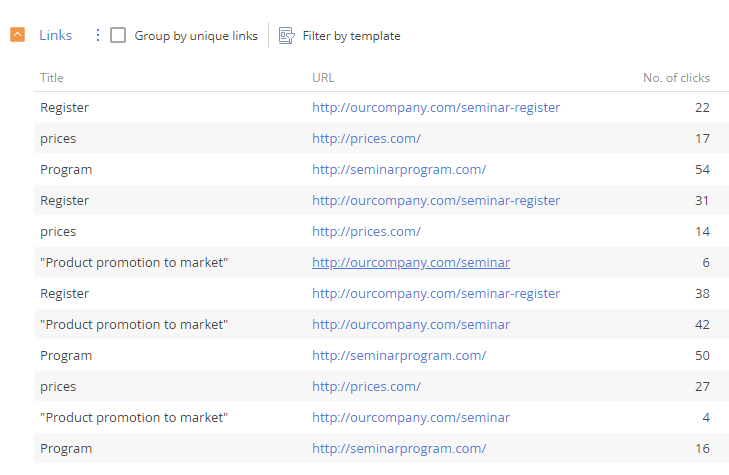
Use this detail to change the link titles that will be displayed on the Link performance and Links details. To do this:
-
-
Select a link in the detail list.
-
-
-
Click
 and select the Edit command in the menu.
-
-
-
Save the changes.
The title remains unchanged in the email template.
-
Use the Group by unique links checkbox to see the click stats totals by the email URLs.
For emails containing dynamic content, the Links detail will display the full list of hyperlinks from all replicas of the template. To evaluate the click dynamics for each of the replicas, use the quick template filter. The detail displays the link URLs as they were added to the email template. The parameters that Creatio automatically assigns to each link are not displayed.
Analyze the dynamics of “opens” and “clicks” time-wise
Use the opens/clicks chart (Fig. 1) to analyze the opens/clicks dynamics during the day to determine the best time to send emails.
The opens/clicks chart is available on the Email totals tab. The chart data updates every two hours.
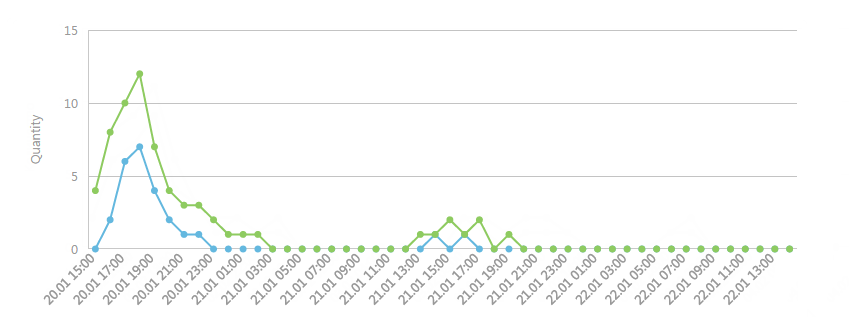
The line chart is used to display the number of unique opens and clicks.
The X-axis displays the period after the email start (2 days by default) in 1-hour intervals.
The Y-axis displays the number of unique recipients. If a recipient opens an email and clicks on a link several times within a certain time, the graph will only take into account the time of the first open and click. Also, if a recipient opens an email and clicks on the unsubscribe link, the chart will record an additional open and click.