In bpm’online sales, you can bring up additional information about any chart element, such as a column, an area, a segment. For example, you can build the “Job titles in R&D department“ chart drilling down the “Employees by department“ column chart.
Any element of the new chart can be drilled down as well. For example, you can display how developers are grouped by their role in decision-making.
To drill down a chart element:
1. Left-click the chart element you want to drill down.
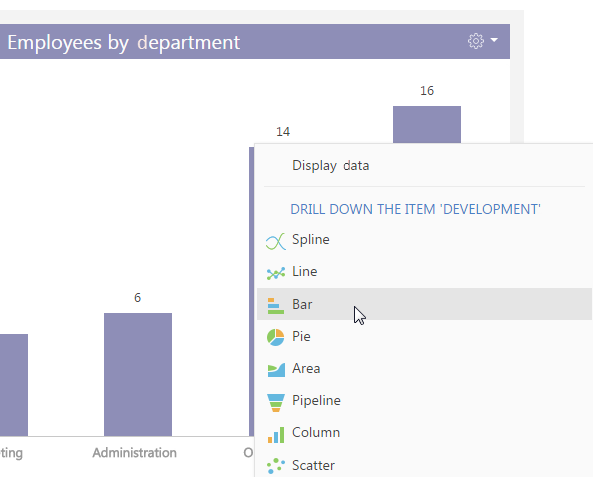
2. In the displayed menu, select the chart type (Fig. 79).
Fig. 79 The diagram menu: selecting a chart type
3. In the opened window, specify the column the chart should be based on, for example, the [Job title] column of the current object.
As a result, the dashboard component will display how the employees of the R&D department are grouped by job title.
To return to the previous chart, use the  button of the chart menu.