Setting up the “Metric” dashboard component
To set up a “Metric” dashboard component, use the metric setup page. To create a metric, enter its title and specify conditions based on which it should be built. Save your changes.
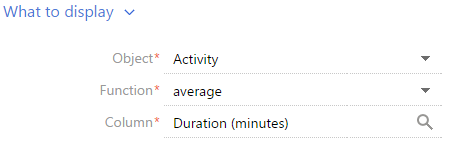
What to display
[Object] - The system object that you want to use for building a chart.
[Function] – How data in a chart is calculated and displayed. The following values can be displayed:
“Count” – The total number of records in a system object.
“sum” – The sum of values for a specified object column, for example, an employee's total duration of activities within a week.
“average”, “minimum”, “maximum”.
[Column] – The column to be used in the calculation. The list of values includes the numeric columns and date columns. For example, specify the “Duration (minutes)” value to calculate the average duration of calls by managers (Fig. 327). This field is not displayed if the “count” value is selected in the [Function] field.
Fig. 327 Setting up the [What to display] detail for a metric
How to filter
Use this detail to specify conditions for selecting the data to be displayed in the metric. For example, to display the average duration of calls made by employees for the previous month only, specify the time period in the filter conditions: “Paid on = Previous month” (Fig. 328).
Fig. 328 Setting up the [How to filter] detail for a metric
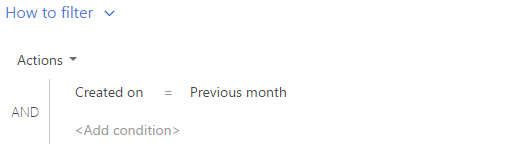
The filter is available if the [Object] field is filled in.
Note
Detailed information about the advanced filter can be found in a separate chapter.
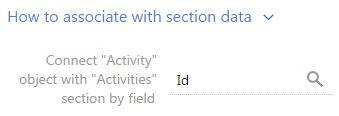
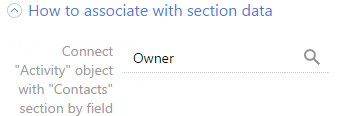
How to connect section data
[Connect ... object with ... section by field] – fill in the field if you want to display the data only for selected records within the section. If you leave this field empty, the filters applied in the section will not be considered when calculating the metric value. The field is displayed if the [Object] field is filled in, but it is not displayed in the [Dashboards] section.
This field can be used in a number of ways.
1.The metric value is calculated based on the records of the section it is added to (metric object corresponds to section object). For example, there is a “Number of activities“ metric added to the [Activities] section. In this case, only the [Id] column will normally be available for the object connection field.
a.If you select the [Id] column in the field (Fig. 329), the metric will only be calculated based on the records that correspond to the filter conditions specified in the section. For example, if you set up a “Completed activities“ folder, then when you select this folder the metric will display the number of the completed activities only. Or, if you select a certain time period, it will display the number of activities within that time period only.
Fig. 329 Connecting a metric to a section by the “Id“ field
b.If you leave the connection field blank, then the metric will display the information for all section records, regardless of the filter conditions set.
2.The metric is calculated based on the data from other sections (metric object does not correspond to section object). For example, there is a “Number of activities“ metric added to the [Contacts] section. Then, in the object connection field, you can select a column from the available list of columns used to connect a metric object with a section object.
a.If you select a column, the metric will only be calculated based on the records that correspond to the filter conditions specified in the section. For example, you can select the “Owner“ column for the “Number of activities“ metric (Fig. 330). Then, if you set a filter in the [Contacts] section, the metric will only display the number of the activities whose owners are displayed in the section. Or you can select the “Author“ column. In this case, the metric will only display the number of activities added by the specified employees.
Fig. 330 Connecting a metric to a section by the “Owner“ field
b.If you leave the connection field blank, then the metric will display the information for all object records used to calculate the metric, regardless of the filter conditions set.
c.The field will also be left blank if the metric data is not connected to the data of the section it is added to. For example, when the “Number of activities“ metric is added to the [Knowledge base] section.
What to display
[Style] – color of the metric.
[Font size] – font size of the digit displayed in the metric, for example, “Default” or “Large”.
[Format] – The display format for the metric. The display format is set up in an additional window (Fig. 331). To open the window, click the  button of the field.
Fig. 331 The metric display format window
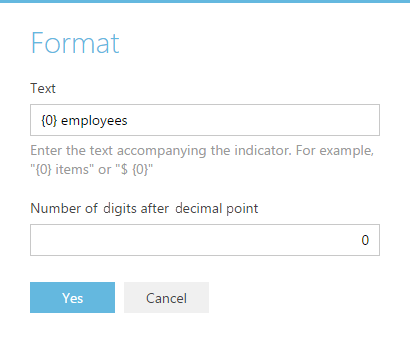
[Text] – Text displayed in the metric. For example, if the metric format should be “Employees – 513”, where 513 is a number of employees, enter the following mask value: “Employees – {0}”. If the format should be “513 employees”, enter the mask value: “{0} employees”
Note
If you delete the {0} variable, the numeric value in metric will not be displayed. To return the variable, clear the field and re-open the window.
[Number of digits after decimal point] – The precision of the fractional part of the numeric metric. For example, set the “1” value to display the number with one digit after the decimal. To display the digit without a decimal, set “0”.