The “Sales pipeline” dashboard component
The [Sales pipeline] dashbard component is designed to analyze sales dynamics by stage (Fig. 91).
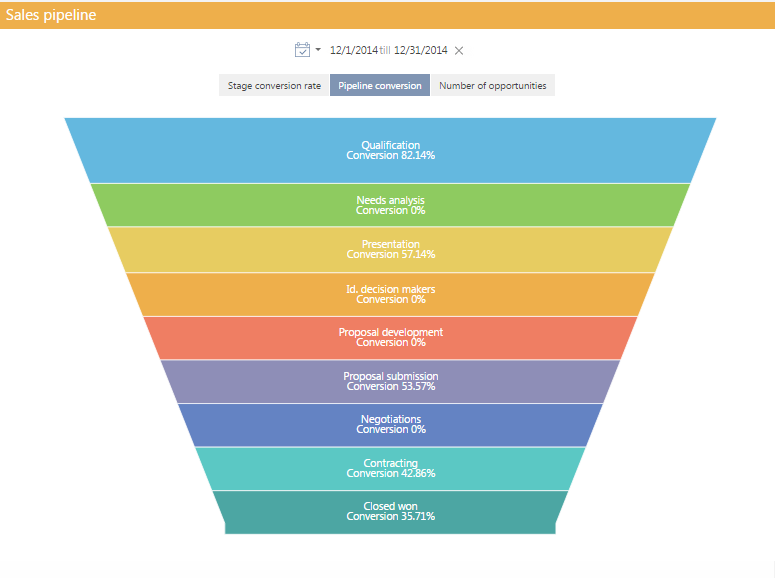
Fig. 91The “Sales pipeline” dashboard component
Note
The “Sales pipeline” dashboard component differs from the “Chart” dashboard component of the “Pipeline” type. The “Chart” dashboard component is described in a separate chapter.
The diagram element's height corresponds to the number of opportunities carrying an up-to-date status. Opportunities with ”Closed lost”, ”Closed won”, ”Closed rejected” and ”Closed rerouted” statuses are not taken into account.
The sales pipeline has its own quick filter that you can use to display data for a certain period of time, for example, for the current month.
Note
Functionality of the quick filter is described in a separate chapter.
The sales pipeline can display data in the following views.
Stage conversion rate displays the percentage of opportunities that have moved from one stage to another later stage during the specified time period.
For example, during the month, 100 opportunities were at the “Needs analysis” stage, and 50 of them moved to the later stage by the end of the month. So, monthly stage conversion rate is equal to 50%.
The pipeline conversion displays the opportunities percentage at a certain stage, during the specified time period, against the total number of opportunities that started during this period.
For example, 100 opportunities started during the month, and 55 of them passed the “Presentation” stage. So, monthly pipeline conversion of the “Presentation” stage is equal to 55%.
The number of opportunities displays how opportunities that started during the specified time period are grouped by stages by the end of that period.
For example, by the end of the month, the 15 opportunities that started during the specified time period are on the “Proposal development” stage. So the pipeline will now display 15 opportunities at this stage.
Setting up the “Sales pipeline” dashboard component
To set up a “Sales pipeline” dashboard component, use the sales pipeline setup page.
Note
The “Sales pipeline” dashboard component should be distinguished from the “Chart” dashboard component of the “Pipeline” type. The “Chart” dashboard component is described in a separate chapter.
To create a sales pipeline, enter its title and specify the conditions based on which it should be built.
How to filter
Use this detail to specify conditions for selecting the data based on which the sales pipeline is built. For example, to display the sales dynamics within the sales pipeline for a certain owner only, specify the required owner in the filter conditions.
Note
Opportunities with ”Closed lost”, ”Closed won”, ”Closed rejected” and ”Closed rerouted” statuses are not taken into account.
How to associate with section data
[Connect “Stage in opportunity“ object with ... section by field] – fill in the field if you want to display the data only for the selected records of the current section. For example, specify the “Opportunity“ value. As a result, the pipeline will only be built based on the records whose [Opportunity] field contains the same value as in the similar field of the [Opportunity] object.
Note
The display of data with respect to the section filters is available for the [Opportunities] section only.
The sales pipeline is built based on the [Stage in opportunity] object records
If you leave this field empty, the filters applied in the section will not be considered when building the pipeline.
The field is not displayed when setting up analytics in the [Dashboards] section.
What to display
[Style] – fill color of the dashboard component title.
[Period by default] – standard filtration period to be used in the quick filter for the sales pipeline, for example, “Current month“.
Note
The functionality of the quick filter is described in a separate chapter.