Customize dashboard widgets
Dashboard widgets (analytic elements) are used for data analysis of sections. Go to the Dashboards view of the required section to work with its analytics. Use the Dashboards section to work with the entirety of Creatio section data analytics.
Data storage structure of dashboards
The dashboards section is a user-defined set of tab elements. The mechanism for working with dashboards is implemented with the help of the DashboardManager dashboard client manager and the DashboardManagerItem element client manager, which represents the tabs. The SysDashboard object is responsible for dashboards in the system. View the SysDashboard object properties in the table below.
Name | Header | Type | Details |
|---|---|---|---|
Caption | Header | String | This information is displayed in the tab header. |
Position | Position | Number | If a position is not specified, the elements are displayed in alphabetical order. |
Section | Section | Lookup | System section. |
ViewConfig | Element (widget) view configuration | Array | |
Items | Element (widget) module configuration | JSON Object | |
Implementing functionality in the dashboards view mode
The hierarchy of classes that implement functionality in the dashboards view mode:
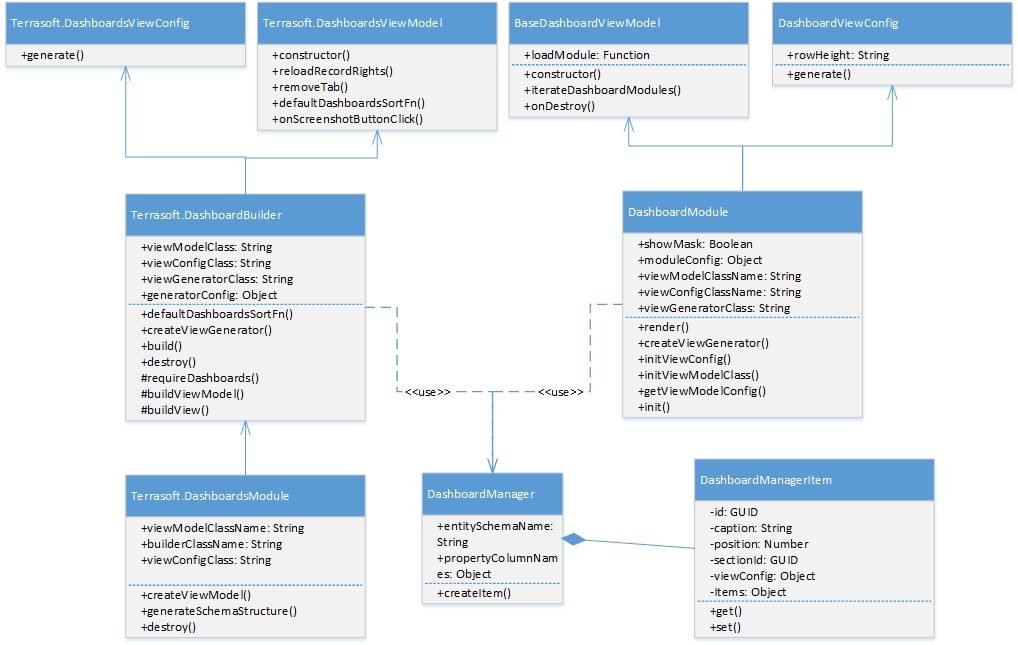
The SectionDashboardModule module:
SectionDashboardBuilderencapsulates the view generation logic and view model class for the Dashboards section module.SectionDashboardsViewModel– the model class of the Dashboards section view model.SectionDashboardsModule– Dashboards section class module.
The DashboardModule module:
DashboardViewConfig– a class that generates the view configuration for the dashboards page view module.BaseDashboardViewModel– a base class for the dashboards page view model.DashboardModule– a class that contains functionality for working with dashboard modules.
The DashboardBuilder module:
DashboardsViewConfig– a class that generates a dashboards module view configuration.BaseDashboardsViewModel– a base class of the dashboards section view model.DashboardBuilder– a class for dashboards module construction.
Implementing functionality in the dashboards view mode
The hierarchy of classes that implement the functionality in the dashboards view mode:
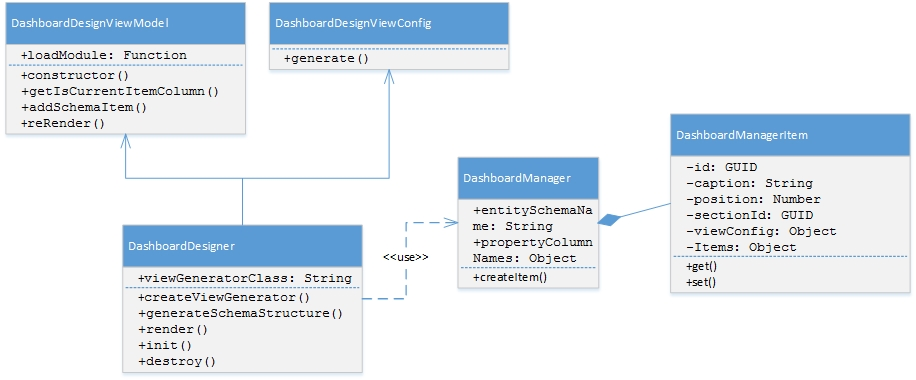
The DashboardDesigner module:
DashboardDesignerViewConfig– a class that generates the view configuration for the dashboards designer module.DashboardDesignerViewModel– a class of the dashboards designer view model.DashboardDesigner– dashboard visual module class.
Base classes that implement widget functionality
BaseWidgetViewModelClass – a base class of the dashboards section view model. To use this class, register the following messages in the module:
GetHistoryState (publish; ptp);ReplaceHistoryState (publish; broadcast);HistoryStateChanged (subscribe; broadcast);GetWidgetParameters (subscribe; ptp);PushWidgetParameters (subscribe; ptp)– if the parameters are drawn from modules (useCustomParameterMethods = true).
BaseWidgetDesigner – base widget settings view schema.
BaseAggregationWidgetDesigner – contains methods for working with aggregate columns and aggregation types.
DashboardEnums – contains an enumeration of widget properties.
Terrasoft.DashboardEnums.WidgetType – contains the widget view mode and design mode configuration of the dashboards.
Dashboard widget types
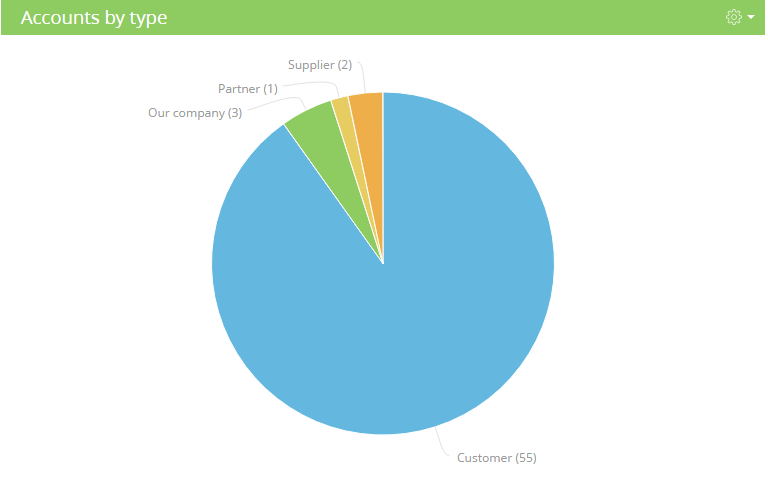
Chart
Charts display multiple system records in the form of diagrams of different types. For example, you can display a pie chart of accounts distributed by type. Charts display information in the form of different diagram types or in a data list form.
Charts functionality implementation classes
ChartViewModel – chart view model.
ChartViewConfig – generates the chart view model.
ChartModule – a module designed to work with charts.
ChartDesigner – view model schema of a chart.
ChartModuleHelper – generates a query using the Terrasoft.EntitySchemaQuery object.
ChartDrillDownProvider – contains methods for working with the "Show data" function (used for working with chart series).
Chart setup parameters
To configure a chart, you need to add the JSON configuration object with the chart properties to the widget module configuration. The widget module configuration is defined by the Items property of the SysDashboard object.
Set the "Chart" value to the widgetType property in the JSON configuration object with widget settings. In addition, assign the parameters property to the object with necessary parameters. View the possible chart parameters in the table below.
Name | Type | Details |
|---|---|---|
seriesConfig | object | The settings of an embedded chart in a series. |
orderBy | string | Sorting field. |
orderDirection | string | Sorting direction. |
caption | string | Chart header. |
sectionId | string | Section id. |
xAxisDefaultCaption | string | Default X-axis header. |
yAxisDefaultCaption | string | Default Y-axis header. |
primaryColumnName | string | Name of initial column. The Id column is the default one. |
yAxisConfig | object | Array of the Y-axis name settings. |
schemaName | string | Chart object. |
sectionBindingColumn | string | Section link column. |
func | string | Aggregate function. |
type | string | Chart type. |
XAxisCaption | string | X-axis caption. |
YAxisCaption | string | Y-axis caption. |
xAxisColumn | string | The X-axis grouping column. |
yAxisColumn | string | The Y-axis grouping column. |
styleColor | string | Chart color. |
filterData | object | Filter settings. |
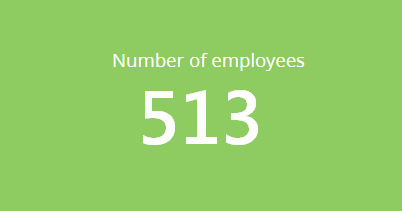
Metric
The "Metric" dashboard displays the number (or date) received by inquiring system data, for example, a total number of company’s employees.
Functionality implementation classes of the "Metric" dashboard
IndicatorViewModel – metric view model.
IndicatorViewConfig – generates the configuration of the metric view model.
IndicatorModule – a module designed to work with metrics.
IndicatorDesigner – view model schema of the metric edit page.
Metric settings
To configure a metric, you need to add the JSON configuration object with Metric properties to the widget module configuration. The widget module configuration is defined by the Items property of the SysDashboard object.
Set the "Metric" value to the widgetType property in the JSON configuration object with widget settings. In addition, assign the parameters property to the object with necessary parameters. View the possible metric parameters in the table below.
Name | Type | Details |
|---|---|---|
caption | string | Metric header. |
sectionId | string | Section id. |
entitySchemaName | string | Metric object. |
sectionBindingColumn | string | Section link column. |
columnName | string | Name of aggregating column. |
format | object | Metric format. |
filterData | object | Filter settings. |
aggregationType | number | Type of aggregating function. |
style | string | Metric color. |
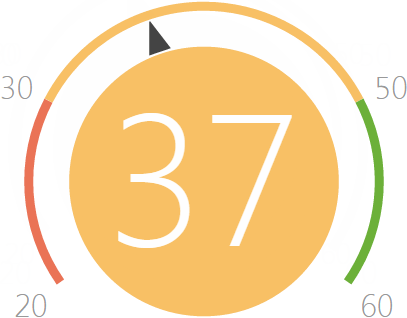
Gaude
A gauge dashboard element displays aggregate data from multiple system records in the form of a dial with green, yellow, and red areas on its scale. For example, you may use this dashboard to display a number of performed activities and compare it to a desired rate.
Gauge functionality implementation classes
GaugeViewModel – gauge view model.
GaugeViewConfig – generates the gauge view model.
GaugeModule – module designed to work with gauges.
GaugeChart – implements a gauge chart component.
GaugeDesigner – view model schema of a gauge.
Gauge settings
To configure a gauge, you need to add the JSON configuration object with the gauge properties to the widget module configuration. The widget module configuration is defined by the Items property of the SysDashboard object.
Set the "Gauge" value to the widgetType property in the JSON configuration object with widget settings. In addition, assign the parameters property to the object with necessary parameters. View the possible gauge parameters in the table below.
Name | Type | Details |
|---|---|---|
caption | string | Gauge header. |
sectionId | string | Section id. |
entitySchemaName | string | Gauge object. |
sectionBindingColumn | string | Section link column. |
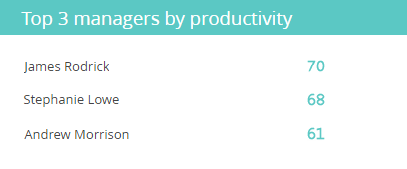
List
A list displays multiple system records in a unified visual form. Lists enable you to limit the number of records displayed to create such dashboards as the "Top ten most productive managers by the number of closed deals", for example.
List functional classes
DashboardGridViewModel – list view model.
DashboardGridViewConfig – generates list view configuration.
DashboardGridModule – module designed to work with lists.
DashboardGridDesigner – list editing page schema.
List settings
To configure a list, you need to add the JSON configuration object with list properties to the widget module configuration. The widget module configuration is defined by the Items property of the SysDashboard object.
Set the "DashboardGrid" value to the widgetType property in the JSON configuration object with widget settings. In addition, assign the parameters property to the object with necessary parameters. View the possible list parameters in the table below.
Name | Type | Details |
|---|---|---|
caption | string | List header. |
sectionBindingColumn | string | Section link column. |
filterData | object | Filter settings. |
sectionId | string | Section id. |
entitySchemaName | string | List object. |
style | string | List color. |
orderDirection | number | Sorting options (1 - ascending, 2 - descending). |
orderColumn | string | List sorting column. |
rowCount | number | The number of rows to display. |
gridConfig | object | List configuration. |
Web-page
The web-page dashboard is used to display web pages on the dashboard panel. It may be an online currency calculator, your corporate website, etc.
Web-page functionality implementation classes
WebPageViewModel – web-page view model.
WebPageViewConfig – generates the web-page view model configuration.
WebPageModule – module used to work with web pages.
WebPageDesigner – web-page widget view schema.
Web-page settings parameters
To configure a web page, you need to add the JSON configuration object with web page properties to the widget module configuration. Widget module configuration is defined by the Items property of the SysDashboard object.
Set the "WebPage" value to the widgetType property in the JSON configuration object with widget settings. In addition, assign the parameters property to the object with necessary parameters. View the possible web-page parameters are listed in the table below.
Name | Type | Details |
|---|---|---|
caption | string | Web-page widget title. |
sectionId | string | Section id. |
url | string | Web-page link. |
style | string | Web-page widget CSS-styles |
Sales pipeline
The "Sales pipeline" dashboard is used to analyze sales dynamics by stages.
Sales pipeline functionality implementation classes
OpportunityFunnelChart – a class inherited from Chart.
Sales pipeline settings
To configure a sales pipeline, you need to add the JSON configuration object with sales pipeline properties to the widget module configuration. Widget module configuration is defined by the Items property of the SysDashboard object.
Set the "OpportunityFunnel" value to the widgetType property in the JSON configuration object with widget settings. In addition, assign the parameters property to the object with necessary parameters. View the possible sales pipeline parameters in the table below.
Name | Type | Details |
|---|---|---|
caption | string | Sales pipeline header. |
sectionId | string | Section id. |
defPeriod | string | Pipeline period (last week by default). |
sectionBindingColumn | string | Section link column. |
type | string | Chart type ("funnel"). |
filterData | object | Filter settings. |