Set up a forecast
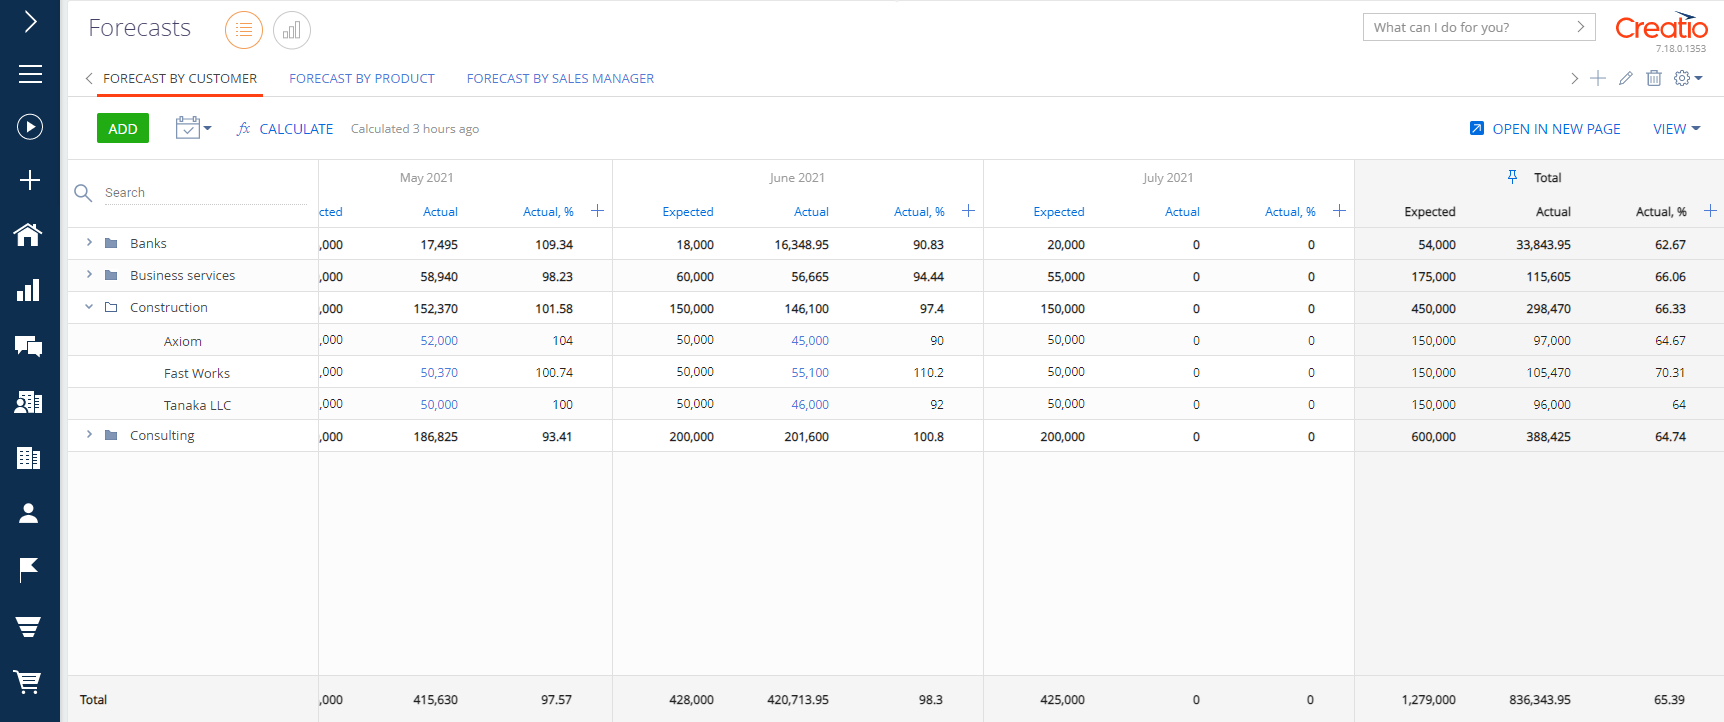
Creatio lets you automate financial, quantitative, and temporal forecasting indicators, as well as analyze the actual results to find bottlenecks and increase efficiency. This functionality is available in the Forecasts section (Fig. 1).
The Forecasts section lets you generate forecasts by key dimensions based on Creatio data, as well as to calculate the actual values.
The forecast setup involves several steps this article covers in depth:
- Set up the forecast object and period.
- Set up the forecast hierarchy.
- Specify the forecast data.
- Set up the forecast columns.
This article also covers:
- The forecast value calculation, manual or automatic with a set frequency.
- The data drilldown that helps to track the indicators’ changes.
Create a quarterly sales forecast and group sales by category, type, and brand.
The calculation must be based on paid invoices. Run calculation: automatically, once a day based on the user’s time zone (GMT-05:00).
When you add new products to the forecast, Creatio must distribute the group indicators among the child elements automatically.
1. Set up the forecast object and period
Select the forecast object (or entity) to use as a dimension when creating a forecast.
We recommend that you select objects that are rarely modified. These objects better suit the long-term data analysis. Examples of good forecast entities include responsible managers (contacts), customers and partners, their need types (your company’s product or service categories), opportunity types, products. Use objects like leads, activities, opportunities, invoices, and orders for calculating the expected indicators instead.
When you add a forecast by an entity that has not been used in forecasts before, Creatio will add a new database table in the background. This table will store all the forecasts configured for this entity.
To select the forecast object and period:
-
Go to the Forecasts section.
-
Click
 in the top right. This opens a box.
 -
Take the following steps in the General tab on the box that opens:
-
Enter the name of the new forecast. In this example, it is "By products."
-
Select the period. In this example, it is "Quarter." This parameter becomes locked after you save the forecast. The following forecast period types are available out-of-the-box: "Month," "Quarter," and "Year." You can create custom periods as well. Learn more in a separate article: Add forecast periods.
-
Specify the forecast entity. In this example, it is "Products."
Note that saving the forecast locks the entity. The forecast name and data hierarchy remain editable. Click
 on the forecast tab panel to edit them (Fig. 2).
Fig. 2 The general forecast parameters 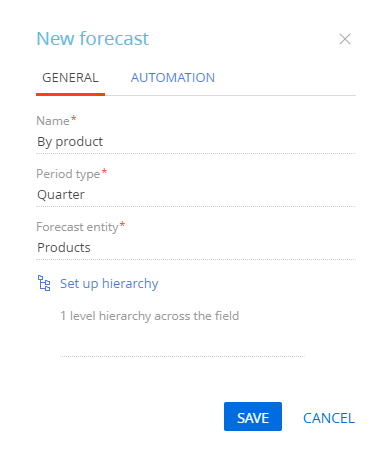
-
-
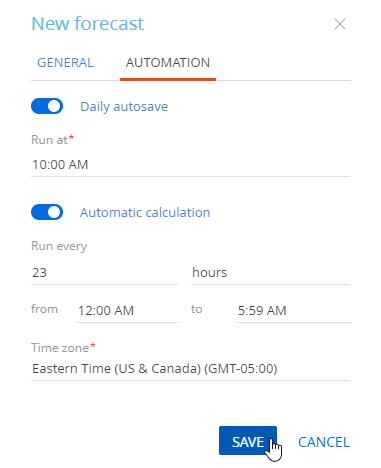
Go to the Automation tab. Here, you can set up the daily autosaves of forecast changes as separate versions and schedule automatic calculations. In this example, set up the daily autosave of expected and actual sales calculations based on the paid invoices.
To set up the daily autosave time of the forecast versions, toggle on the Daily autosave switch and specify the autosave time in the Run at required field. This setting is the only way to save a new forecast version.
To enable the automatic forecast calculation, toggle on the Automatic calculation switch and specify the calculation frequency, as well as the user time zone. In this example, set up calculations to run every 23 hours when the load on Creatio is the lowest: from 12:00 AM to 5:59 AM. Time zone: Eastern Time (US & Canada) (GMT-05:00).
-
Click Save (Fig. 3).
This will create a new forecast with the settings you specified. When you add an entity that has not been used in forecasts before, Creatio will add a new database table in the background. This table will store all the forecasts configured for this entity.
Proceed to the forecast hierarchy setup.
2. Set up the forecast hierarchy
You can group the forecast entities by set conditions if the entities contain too much data to show as a plain list. In this example, the groups are "Category," "Type," and "Brand." A forecast can have up to 10 grouping levels. You can modify the hierarchy at any time.
To group the forecast objects:
-
Click
on the forecast page and go to the Set up hierarchy field group. -
Select the column for grouping objects on the first hierarchy level. In this example, this is the Category column.
-
Select columns for each subsequent hierarchy level in a similar way. In this example, these are the Type column on the second hierarchy level and the Brand column on the third level.
-
Click Save (Fig. 4).
As a result, Creatio will generate a table that contains forecast entities grouped by the set conditions.
Proceed to specify the forecast data.
3. Specify the forecast data
Specify the data to use in calculations.
To do this:
-
Click Add on the forecast page. This opens a box.
-
Select the needed records of the forecast entity in the box that opens. For example, a product list. Click Actions → "Select all" to add all available records to the forecast.
-
Click the Select button.
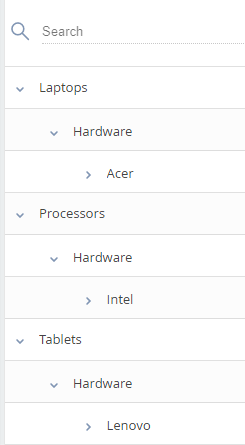
As a result, the list of selected records will appear in the left part of the forecast. Creatio will group the records as per the pre-configured hierarchy (Fig. 5).
Hover over a record and click  to remove it from the forecast.
Click on the forecast tab panel to change the forecast hierarchy.
Proceed to column setup.
4. Set up the forecast columns
Creatio calculates the forecast indicators in the forecast columns. Forecasts have the following column types:
-
Editable. Specify the value manually.
-
Value from object. Creatio pulls the value from the database according to the set parameters.
-
Formula. specify a formula for calculating the value based on the data available in Creatio.
For new forecasts, a single Expected column is available by default for each period. You can edit the column values, change the column settings, or delete the column.
Set up the Forecast column
Enter the expected indicators manually for each forecast structure element or set up the automatic distribution. If you set up the automatic distribution, you will only need to enter the expected indicators for parent elements. Creatio will calculate the values for the child elements automatically. To do this:
-
Hover over the Expected column title and click the
 button that appears on the left.
 -
Select the Allow editing of group indicators checkbox in the column setup box.
As a result, Creatio will save the new values automatically when you change the expected indicators. Note that this will not create a new version of the forecast. When you add new products to the forecast, you will only be able to edit the expected indicator for the group that includes those products. Creatio will calculate the expected values for new records in the group proportional to the number of child elements. At the lowest level, the indicators are uneditable and always equal the "Expected indicators of the upper level / number of the nested levels" ratio. However, intermediate indicators are editable. If you change them, Creatio will recalculate the values of both child and parent elements.
Set up the Actual column
-
Click
 to the right of the Expected column. This opens a box.
 -
Specify the name of the new column ("Actual") and its type ("Value from object") in the box that opens. The box displays a list of column parameters.
-
Fill out the column parameters:
-
Select the Creatio object to be used as data source in the Section field. In this example, it is "Product in invoice." Configure the filters to include only the paid or partially paid invoices within the specified period when calculating the actual forecast data.
-
Select the calculation method in the Function field. The function can be "sum," "count," or "average." For this example, select "sum."
-
Select the base value for the calculation in the Indicator field. In this example, it is "Total, base currency."
-
Select the field that binds the data object ("Product in invoice") to the forecast entity ("Product") in the Forecast object binding field. In this example, this is the "Product" field.
-
-
Save the column.
Fig. 6 Set up a Value from object type column 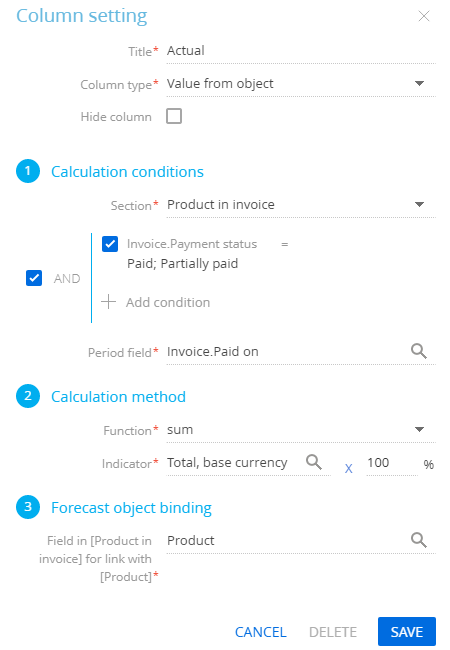
Set up the Actual,% column
-
Click
to the right of the Actual column. This opens a box. -
Specify the name of the new column ("Actual, %") and its type ("Formula") in the box that opens. The box displays a field for entering the formula, available columns and mathematical operations, as well as the Calculate totals using the formula toggle.
-
Set up the formula that calculates the column value.
-
Turn on the Calculate totals using the formula toggle to apply the formula calculations to every forecast hierarchy level (Fig. 7).
-
Save the column.
Fig. 7 Set up a Formula type column 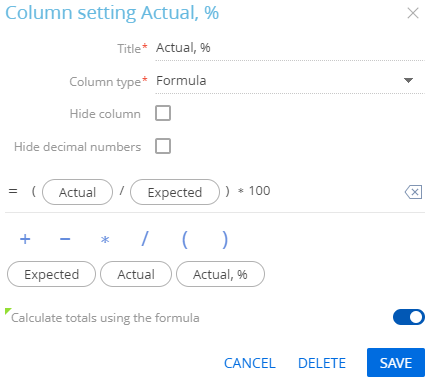
As a result, the configured columns will be added to the table and will display the calculated indicators.
Calculate a forecast
After the column setup, enter the expected indicators manually for each forecast structure element. Alternatively, set up the automatic distribution and click Calculate.
After the calculation is finished, you will receive a notification on the communication panel. As a result, Creatio will populate the expected forecast indicators with data taken from the database or calculated using the formula.
To change the column settings, hover over the column title and click on the left.
To hide a column, hover over the column title and click → select the Hide column checkbox.
To delete a column, hover over the column title and click → Delete.
If necessary, drag the forecast columns to change their order (Fig. 8).
Click  to lock the Totals column on the right. This makes it easier to manage the summary indicators.
Drill down the data
You can review the data used to generate the forecast tab values. This feature is available for cells of the "Value from object" type. Creatio attaches links to the cell values that can be drilled down. Click them to display the records used to calculate the selected value (Fig. 9).
When drilling down the data, you can:
- click
 to resize the drilldown window
 - click
 and
and  to hide or show the window
 - Click → Select fields to display to select fields to display
- Click → Export to Excel to export data to Excel