Front-end debugging is debugging of Creatio front-end implemented in configuration element schemas of the Client module type. Learn more in a separate article: Client module.
Integrated debugging tools
Debug the front-end from the browser directly. To do this, use integrated developer tools provided by all supported browsers. All browsers provide similar debugging tools. Learn more in the official Google Chrome documentation, official Microsoft Firefox documentation, official Microsoft Edge documentation, and official Apple Safari documentation.
You can open the debugging tools in the following ways:
- Press F12 or Ctrl+Shift+I in Google Chrome
- Press F12 in Microsoft Firefox
- Press F12 in Microsoft Edge
Scripts and breakpoints
The development tools let you view the complete list of scripts that are connected to the page and downloaded to the client. You can set a breakpoint wherever you want the code to stop.
To set a breakpoint:
- Find the needed script file (you can do it by pressing Ctrl+O or Ctrl+P) and open it.
- Go to the code line to set the breakpoint. For example, you can search for a method by name.
-
Set a breakpoint.
You can set a breakpoint in the following ways:
- click the line number
- press F9
- click Add breakpoint in the context menu
You can also set a conditional breakpoint which lets you set acondition that triggers the breakpoint.
Use the debugger command to suspend the execution of a script directly from the code.
You can view the current values of the variables, execute commands, etc. after the code execution is suspended.
Manage front-end debugging
Check the values of the call stack variables after the code execution is suspended. Then, trace code for fragments where the actual program behavior differs from the expected.
View the browser debugger commands that let you navigate the code step by step in the table below.
Google Chrome  |
Microsoft Firefox  |
Microsoft Edge  |
|
|---|---|---|---|
Learn more about the features and commands of the browser navigation bar in the official documentation.
Browser console actions
You can execute the following actions at the browser console:
- call JavaScript commands
- display debugging information
- display trace information
- measure and profile code
To do this, use the console object.
Call JavaScript commands
- Open the browser console. To do this, open the Console tab. To open the Console tab besides the debugger, click Esc.
- Enter JavaScript commands at the console.
- Press Enter to execute the commands.
Display debugging information
The console can display the following debugging information:
- information messages
- warnings
- error messages
To display debugging information, use the corresponding methods of the console object listed in the table below.
The console applies a unique style to each message type.

The methods of the console object let you format console messages. You can use special control sequences (templates) in the message text. The templates are replaced by the corresponding values when displayed. The values are also transferred to the function in order of appearance.
View the formatting templates for the methods of the console object in the table below.
Display trace information
View the browser console methods that let you trace and verify expressions in the table below.
Measure and profile code
View the browser console methods that let you measure code execution time in the table below.
View the browser console methods that let you profile code and display the profiling stack in the table below. The profiling stack contains detailed information about the time it takes the browser to execute the operation.
The profiling results are displayed in the following browser tabs:
- Profiles in Google Chrome
- Performance in Microsoft Firefox
- Profiler in Microsoft Edge
Front-end debugging mode isDebug
The front-end debugging mode isDebug lets you retrieve detailed information about Creatio errors and track them in the code.
Browser minifies code in regular mode. This means client scripts are assembled in the all-combined.js file. The file is assembled when the assembly is created and contains the entire functionality. If you enable isDebug mode, the assembly and minification of *.js files are turned off. Client scripts are displayed as separate files.
To configure front-end debugging mode:
-
Identify the current status of the front-end debugging mode. To do this, press F12 or Ctrl+Shift+I in Google Chrome.
Besides the status of the front-end debugging mode, the console displays a code to activate or deactivate it.

-
Enable front-end debugging mode.
You can enable front-end debugging mode in the following ways:
-
Run code below at the browser console:
-
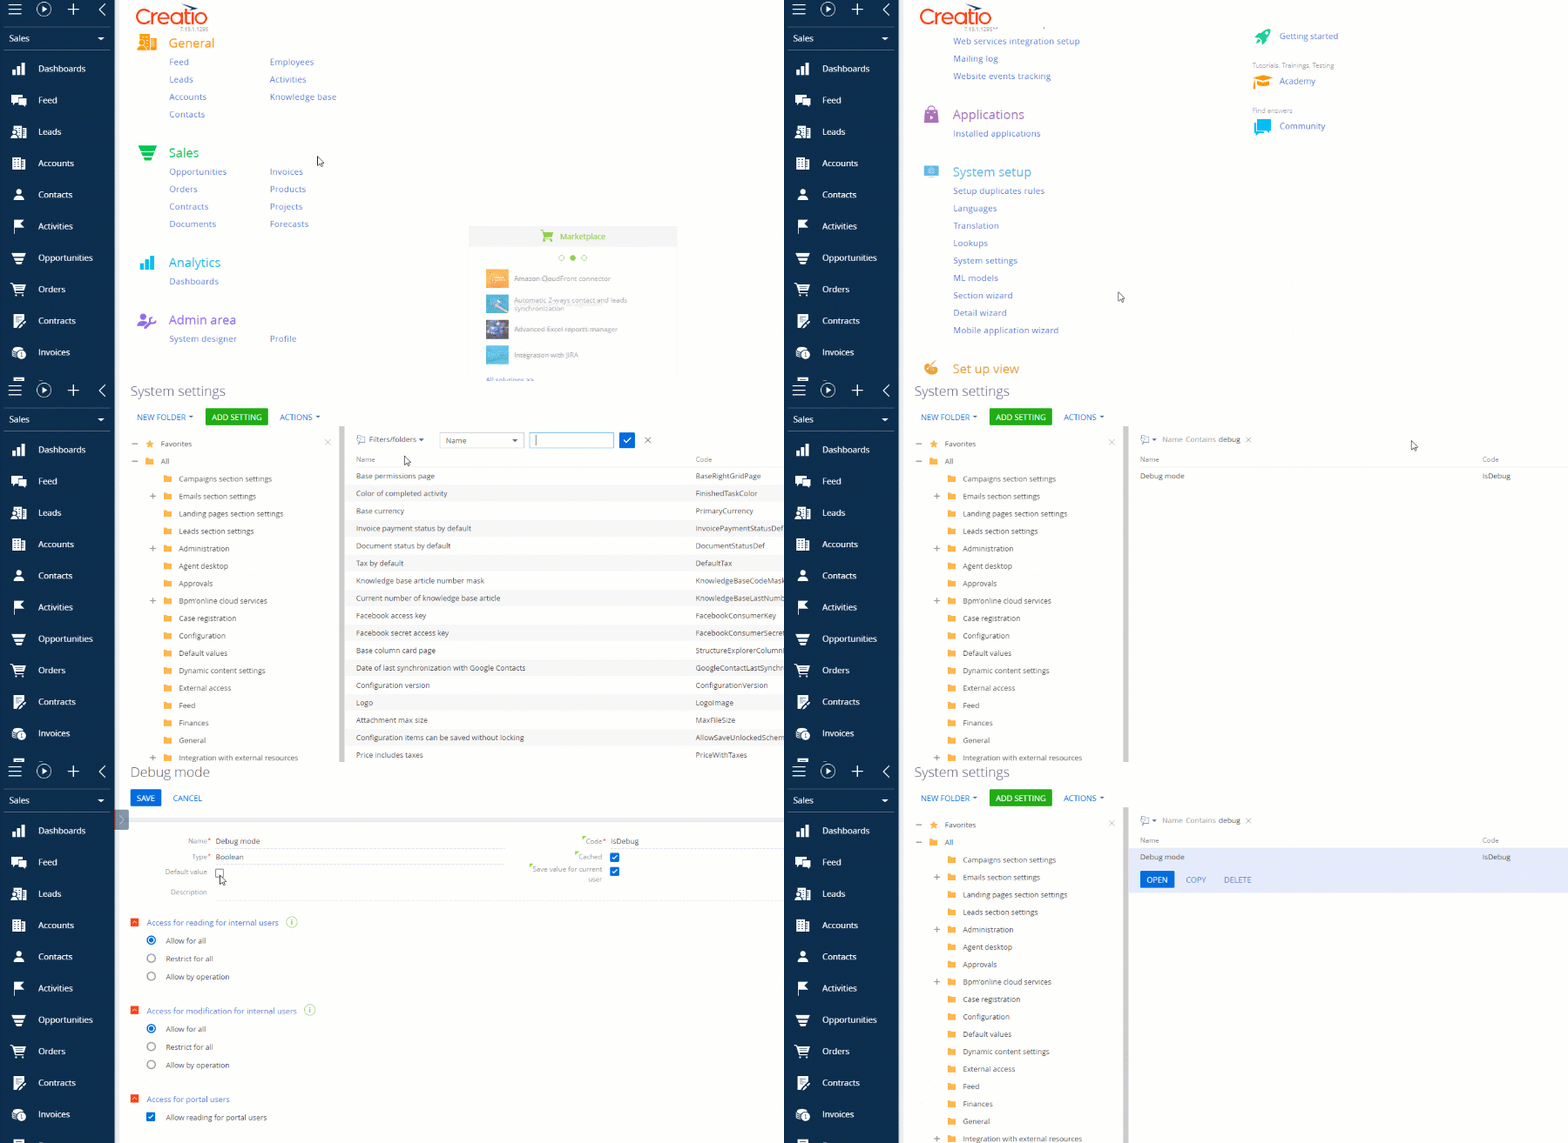
Change the value of the Debug mode (isDebug code) system setting.

-
- Refresh the page or press F5 to apply the changes.
Creatio displays a Debug indicator next to the version number after you turn on front-end debugging mode.

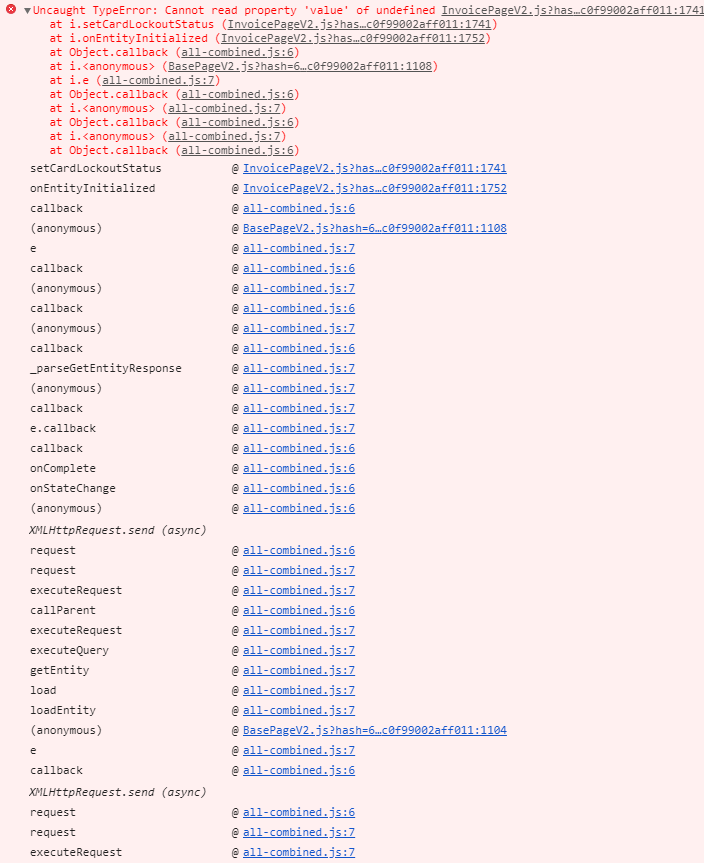
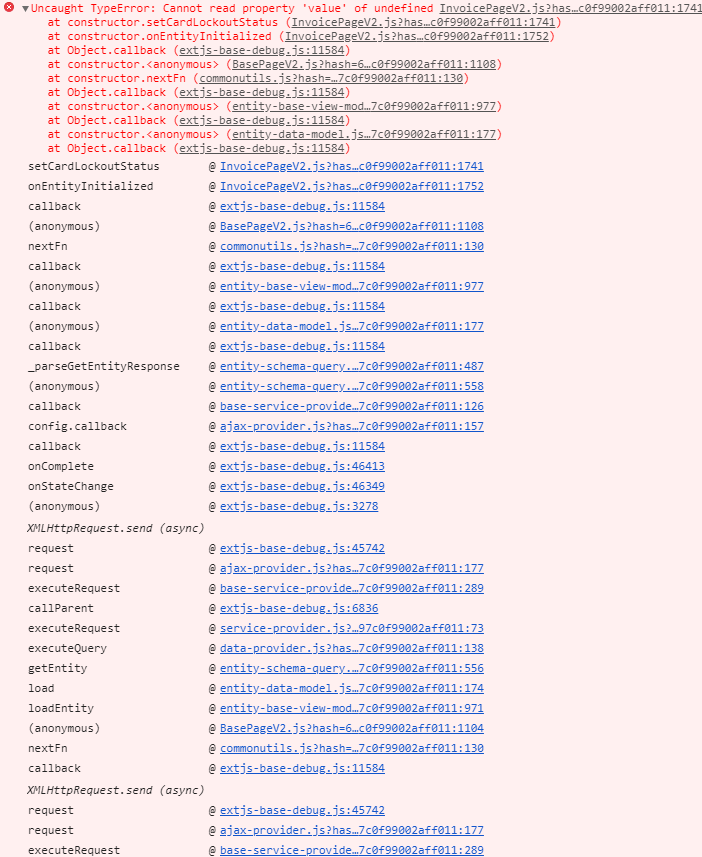
View the examples that display error information in the console when isDebug mode is turned on and off on the figures below.


To check the current status of the client debugging mode, open the browser console by pressing the F12 key or pressing Ctrl+Shift+I. Aside from the current status of the client debugging mode, the console will display the code to enable or disable debugging.

You can enable the client debugging mode using the following methods:
- Execute the following code in the browser console
- Change the value of the [Debug mode] system setting.

To apply the changes, refresh the page or hit F5.
Upon activating the client debugging mode, you will see the Debug indicator next to the site’s version number.

The figures below show examples of errors displayed in the console with the ‘isDebug’ mode disabled and enabled.


