Add dashboards as page widgets
You can add dashboards on a record page tab or in the record profile. For this, use the "Widgets" page elements (Fig. 1) available on the left-side panel of the Page Designer.
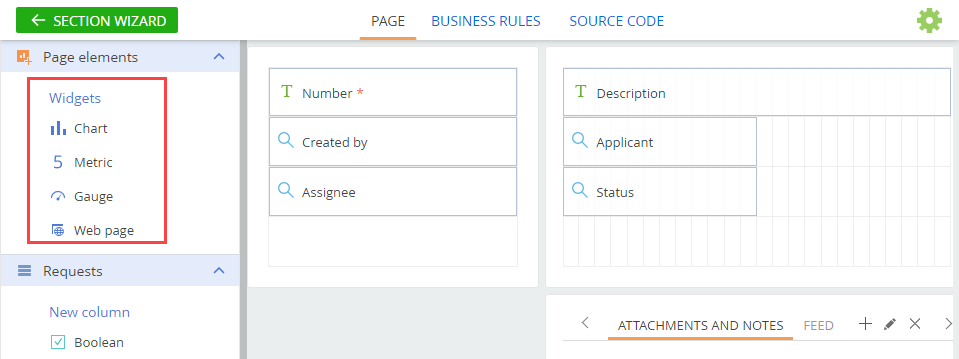
You can add the following types of dashboards on a record page:
More information about setting up different types of dashboards is available in the Dashboards article.
Since Creatio 8.3.1, Section and Detail Wizards for Classic UI are no longer available for creating new sections and details. These tools will be deprecated in future releases. We recommend using the modern Freedom UI tools that provide a more flexible and future-ready experience. Learn more: Overview of Freedom UI Designer and its elements.
Create a chart that would display the dynamics of communication with a customer on the History tab of the contact page.
To add a chart on the contact page:
-
Open the Contacts section.
-
Click View → Open Section Wizard.
noteIf you need to add dashboards on a detail page, use the Detail Wizard instead of the Section Wizard.
-
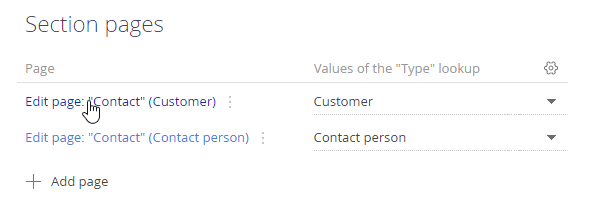
In the "Section pages" block of the Section Wizard:
-
In the Page Designer that opens, click the History tab (Fig. 3). This tab will display your diagram.
Fig. 3 Switching to the History tab 
-
Add a new "Dynamics of communication" field group. Place the field group at the top of the History tab page. This field group will contain the newly created diagram.
-
Expand the Page elements block and drag the needed widget on the page. For example, drag-and-drop the Chart widget to the new Dynamics of communication field group. Areas, where you can place the chart, will be highlighted in blue (Fig. 4).
Fig. 4 Adding a chart on the contact page 
-
On the opened chart setup page, populate the first series of the chart that would display the number of calls of the contact for the needed period, e.g., the previous quarter. Set the parameters as follows:
Fig. 5 Setting up the Calls and emails for the previous quarter chart 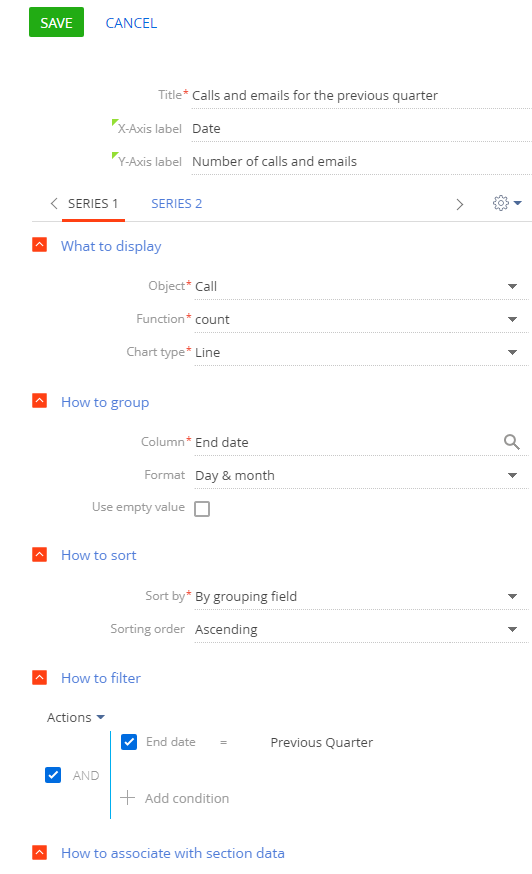
- Title – "Calls and emails for the previous quarter"
- X-Axis label – "Date"
- Y-Axis label – "Number of calls and emails"
- Object – "Call"
- Function – "Count"
- Chart type – "Line"
- How to group – set grouping by the "End date" column for calls.
- Format – "Day & month"
- How to filter – Specify the "End date = Previous quarter" for calls.
- How to associate with section data – Specify "Id" to display the data for the selected contact only.
-
Add another series to your chart widget by clicking
 and selecting the "Add series" option (Fig. 6).
Fig. 6 Adding series to a chart widget 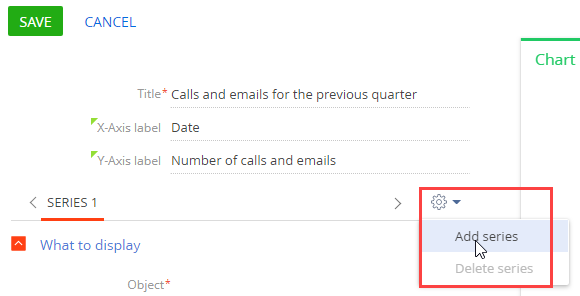
-
Populate the properties of the second series:
- Object – "Activity"
- Function – "Count"
- Chart type – "Line"
- How to group – set grouping by the "Due" column for activities.
- Format – "Day & month"
- How to filter – Specify two conditions for activities: "Type = Email" and "Due = Previous quarter."
- How to associate with section data – Specify "Id" to display the data for the selected contact only.
-
Click Save.
-
For the correct displaying of data, adjust the size of the chart (Fig. 7).
Fig. 7 Resizing the chart 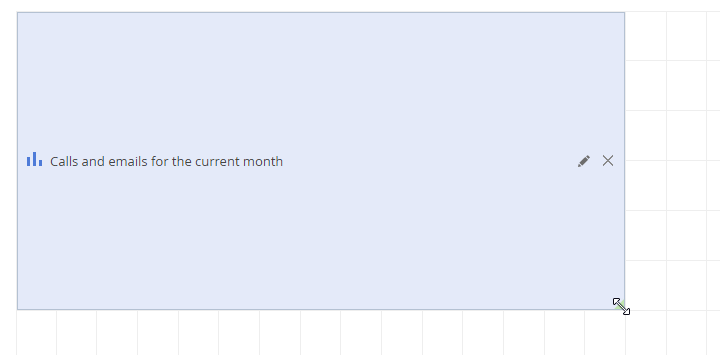
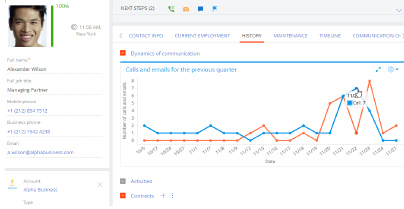
As a result, the chart showing the dynamics of communication with the contact for the previous quarter will be displayed on the contact page (Fig. 8).
Learn more about configuring charts in the Chart dashboard tile article.