Back-end debugging tools overview
Back-end debugging is debugging of C# code schemas, for example, existing base schemas, custom configuration classes, web services, etc.
Execute back-end debugging
Debug the C# code schemas using the integrated debugging functionality of external IDEs, for example, Visual Studio Code.
External IDE debuggers let you execute the following actions:
- suspend the execution of methods
- check the values of variables
- change the values of variables
The following example executes back-end debugging in the Visual Studio Code external IDE below.
To execute debugging in Visual Studio Code, ensure the following requirements are met:
- Use Creatio on-site.
- Turn off the file system development mode.
- Select the Suppress JIT Optimization checkbox in Visual Studio Code (Options menu → Debugging item → General block). The checkbox lets you control the values of variables while debugging. Learn more about the impact of optimized and unoptimized code on debugging: official vendor documentation (Visual Studio).
To execute back-end debugging:
- Export the C#-code schemas to the local directory files.
- Create a Visual Studio Code project for debugging.
- Add the exported files to the Visual Studio Code project.
- Connect the project to the IIS server workflow and execute debugging.
Solve debugging issues
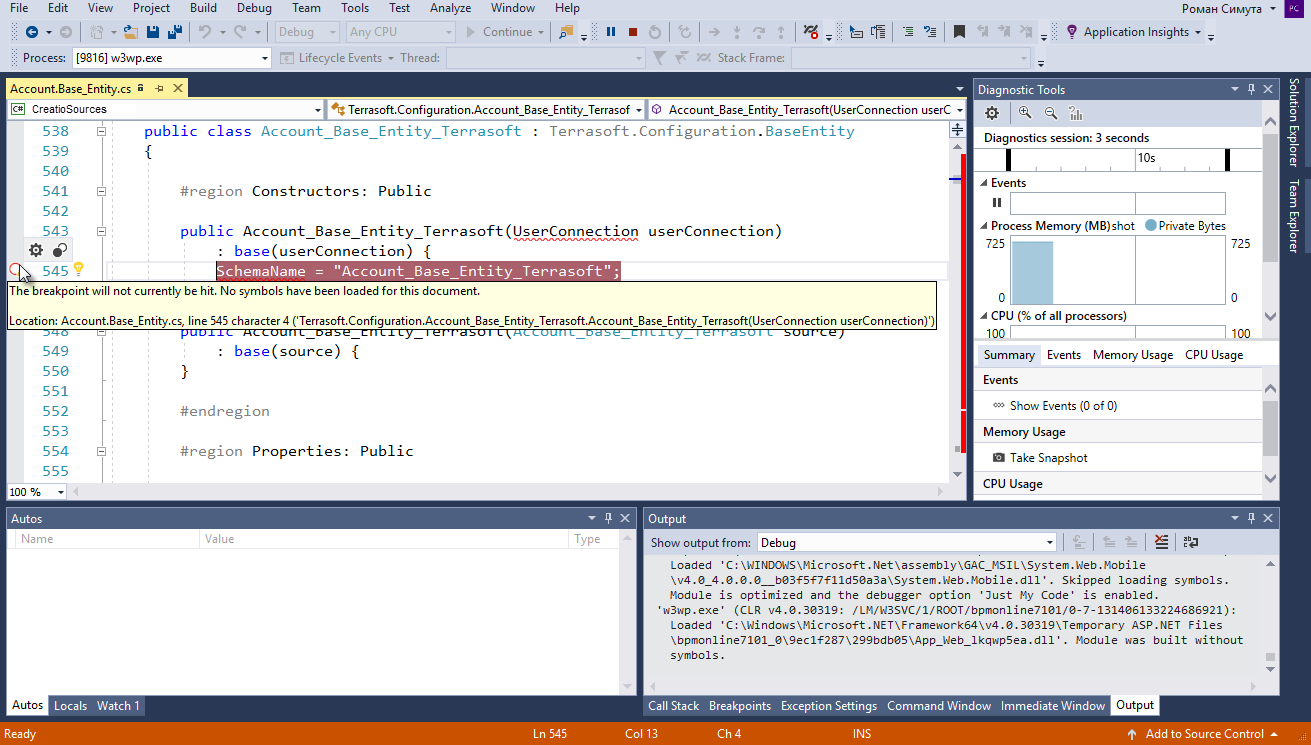
The breakpoint is displayed as a white circle with a red border. This breakpoint does not stop the script execution. Hold the pointer over the inactive breakpoint character to view the tooltip about the issue.
Solution:
- Stop debugging (Debug menu → Stop Debugging item).
- Close the file that contains the debugged source code.
- Execute the Compile all action in the Configuration Creatio section.
- Reconnect the project to the IIS process when compiling and reexporting the source code files.
- Reopen the debugged source code file after the compilation finishes.
You can also recompile code without closing the file and reconnecting the project to the IIS process.
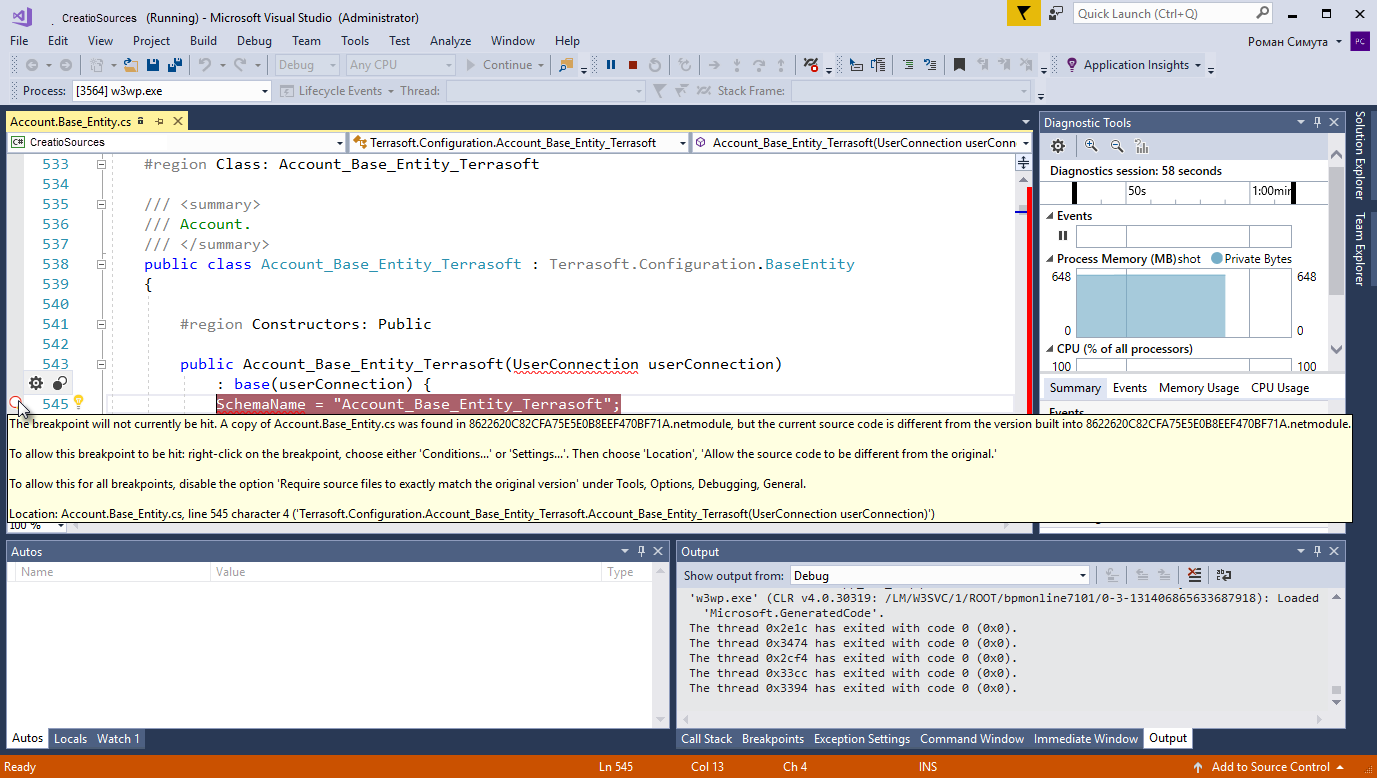
Message about non-uniform end-of-line characters appears after you reopen the source code file.
Solution:
- Click No to cancel character normalization. If you click Yes to normalize the characters, the breakpoint might become inactive again.
- Execute one of the suggested solution options from the tooltip that also specifies the cause of the issue (file version mismatch).
Resources
JIT Optimization and Debugging (official Visual Studio documentation)